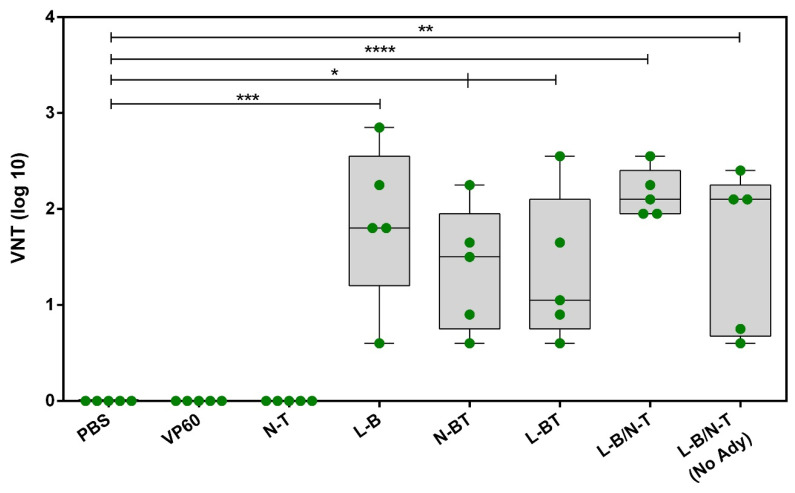
Figure 4.
Box plot showing the distribution of FMDV-neutralizing antibody titers elicited by the chimeric VLPs. In this graphic, the box is defined by the interquartile range (IQR)—the 25th and 75th percentiles of the distribution; the horizontal line within the box represents the median (50th percentile) and the vertical lines extend to the extreme observations. Each symbol represents the value for an individual mouse (n = 5 per group). A value of 0 was assigned to all sera with VNT titers <0.6 (bellow detection limit). Statistically significant differences in FMDV VNT titers with respect to those corresponding to the VP60 group are shown as * p < 0.05, ** p < 0.01, *** p < 0.001, **** p < 0.0001. Identical statistically significant differences in FMDV VNT were found with respect to those corresponding to the N-T group (not shown in the graph for simplification of the figure).

