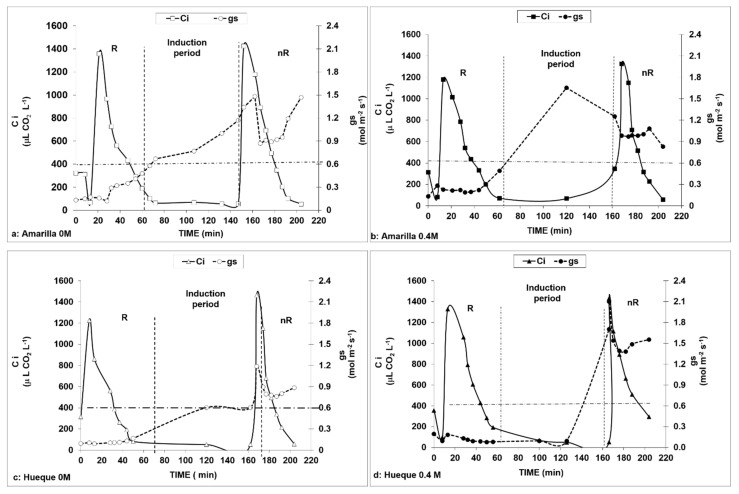
Figure 4.
Curves of each ecotype used to determine the times necessary to induce stomatal opening. The continuous line represents the internal concentration of CO2 (Ci), and the dotted line is stomatal conductance. The line parallel to the x-axis represents the minimum limit required for open stomata. Lines parallel to the y-axis define the measurement periods. R—measurements with stomatal constraints; nR—measurements with no stomatal constraints. The induction period corresponds to the time interval required to induce stomata opening by applying a concentration of 50 μL CO2 L−1. Internal concentrations correspond to IRGA measurements with respect to the application of a specific environmental CO2 concentration, applied according to the time sequences described in Table 1.

