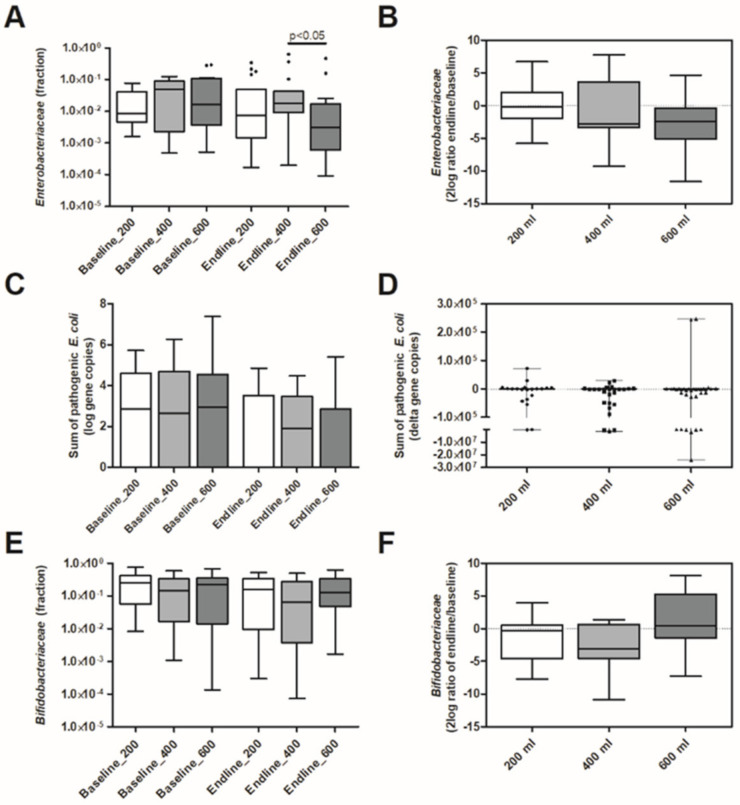
Figure 3.
Effect of daily intakes of 200, 400, or 600 mL of YCF during 6 mo. on Enterobacteriaceae, pathogenic E. coli and Bifidobacteriaceae. Boxplots are displayed as Tukey whiskers. (A) Relative abundance of Enterobacteriaceae at baseline and endline. At endline relative abundance was significantly higher in the 400 mL group compared to the 600 mL group (p < 0.05 based on Dunn’s posthoc test). (B) Change in the relative abundance of Enterobacteriaceae over time (2log ratio of relative abundance at endline and baseline). (C) Abundance of pathogenic E. coli at baseline and endline (pathogenic E. coli represents the sum of the log gene copies of EPEC, ETEC lt and ETEC st). (D) Change in abundance of pathogenic E. coli over time (delta gene copies). (E) Relative abundance of Bifidobacteriaceae at baseline and endline. (F) Change in the relative abundance of Bifidobacteriaceae over time (2log ratio of relative abundance at endline and baseline).

