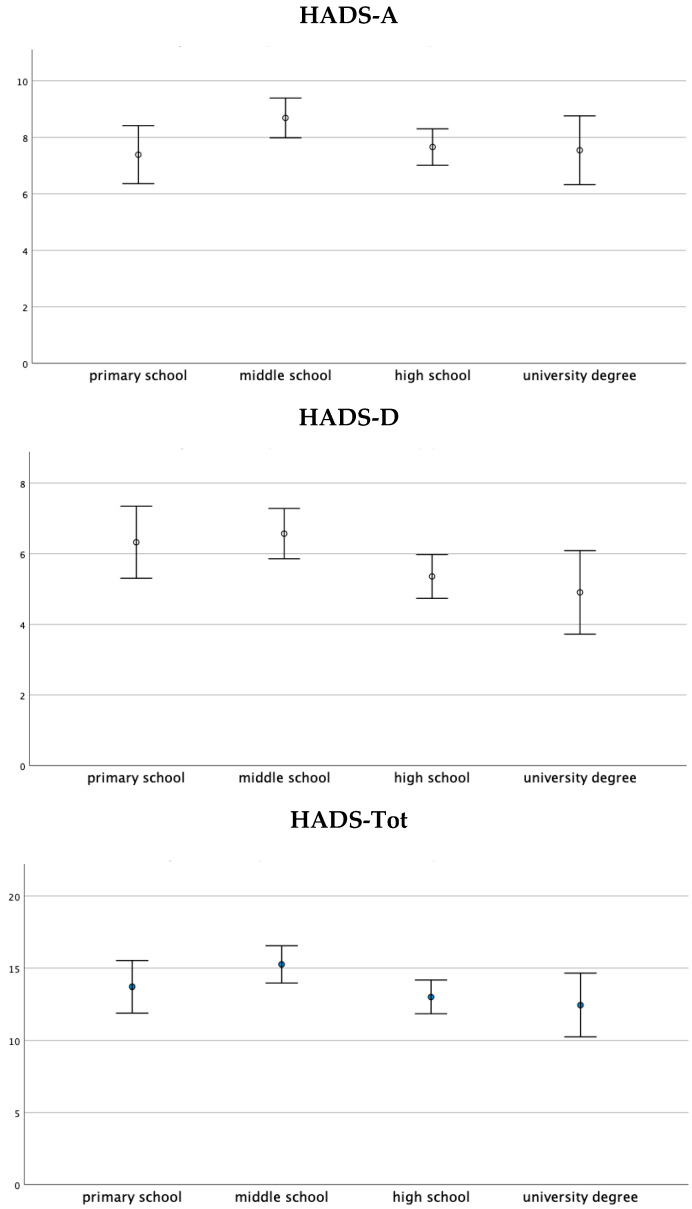
Figure 3.
One-way ANOVA on the HADS-A, HADS-D, and HADS-Tot scores with respect to the education level group. Data are presented as the mean ± standard deviation. The HADS-A, HADS-D, and HADS-Tot scores were significantly different between the education level groups (respectively, F(3, 416) = 2.296, p < 0.05; F(3, 416) = 3.277, p < 0.05; and F(3, 416) = 2.832, p < 0.05).

