
Figure 5.
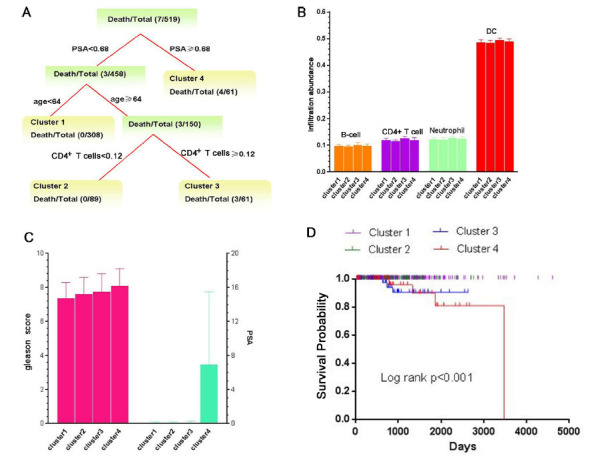
The distinct classes by combining immune cells infiltration and PCa-related traits. (A) The survival tree model based on TIMER immune infiltration abundances. Each termination node in the tree represents the distinct class. (B) The immune infiltration abundance comparison for four distinct classes. (C) Gleason score and PSA comparison for four distinct classes. (D) Kaplan-Meier survival analysis of patients among different clusters. P-values are based on from log-rank tests.