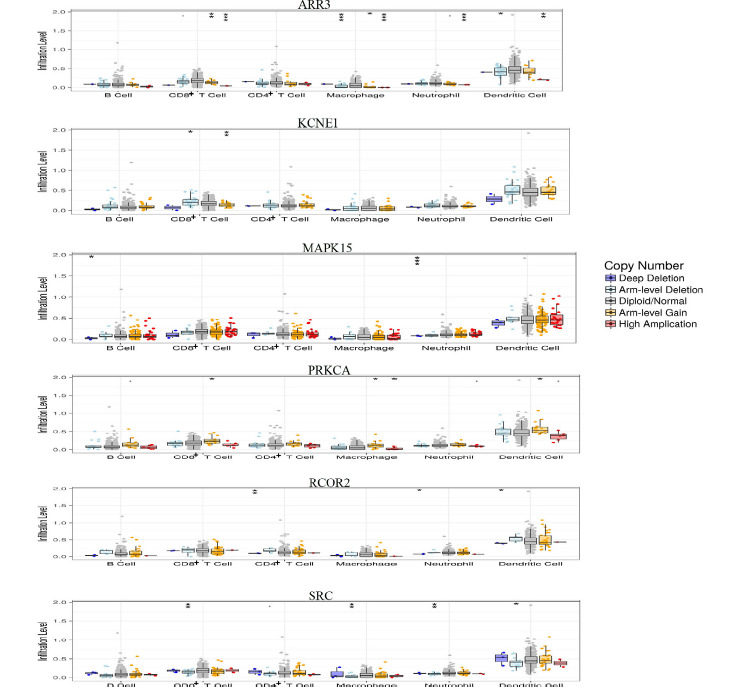
Figure 6.

SCNA analysis for the identified PCa-survival related genes. Box plots show the distributions of each immune subset at each copy number status in given genes. The infiltration level of immune cells for each SCNA category is compared between PCa patients and the normal using two-sided Wilcoxon rank sum test. .P<0.1,*P<0.05, **P<0.01,***P<0.001.
