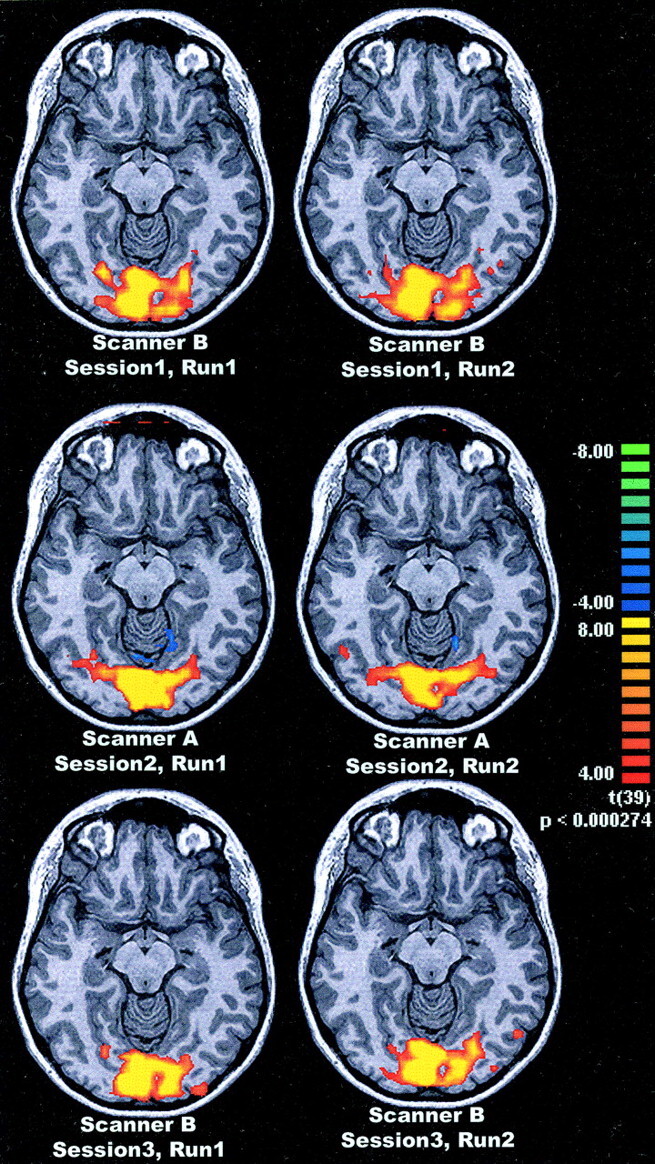
Fig 1.

Example of functional MR imaging activation, in one subject after visual stimulation (checkerboard, 8 Hz), superimposed on an anatomic image (MP-RAGE). Pixels with a z-score above 4.0 are coded as to the bar on the right. Top row shows runs 1 and 2 from session 1 with system B, middle row shows both runs from session 2 with system A, and bottom row shows the runs from session 3 with system B.
