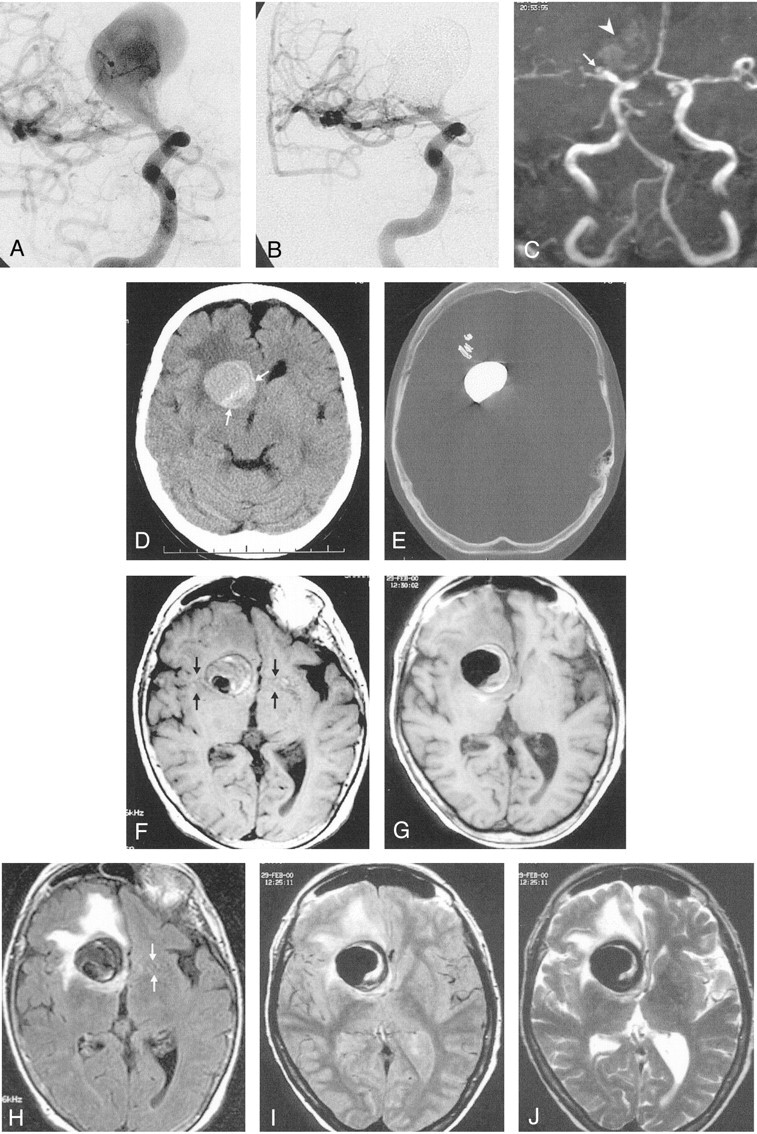
Fig 3.

A and B, Right internal carotid angiograms obtained before (A) and after (B) treatment. Images show that the partially thrombosed giant right ICA aneurysm is almost completely occluded; it has a small residual neck.
C, Time-of-flight MRA successfully demonstrates the neck residuum (arrow). Note the slight hyperintensity due to thrombus in the region of giant aneurysm (arrowhead).
D, Pretreatment nonenhanced CT image shows the partially thrombosed giant aneurysm with surrounding edema and mass effect. Arrows indicate the thrombosed portion.
E, Posttreatment CT image (bone settings) shows that the attenuating cast of the polymer fills the aneurysm sac, except for the thrombosed portion.
F–J, Axial MR images through the same level shows the hypointensity of the aneurysm lumen becomes more prominent. The hypointensity extends into the isointense or hyperintense thrombosed portion after treatment; this may indicate the insinuation of the polymer into the thrombus in the sac. The edema and mass effect of the aneurysm persist but do not increase after treatment.
F, Pretreatment T1-weighted image. Note the pulsation artifact with the same caliber as the patent portion (arrows).
G, Posttreatment T1-weighted image.
H, Pretreatment fluid-attenuated inversion recovery image.
I, Posttreatment proton density–weighted image. The artifact disappears on this corresponding image.
J, Posttreatment T2-weighted turbo spin-echo image.
