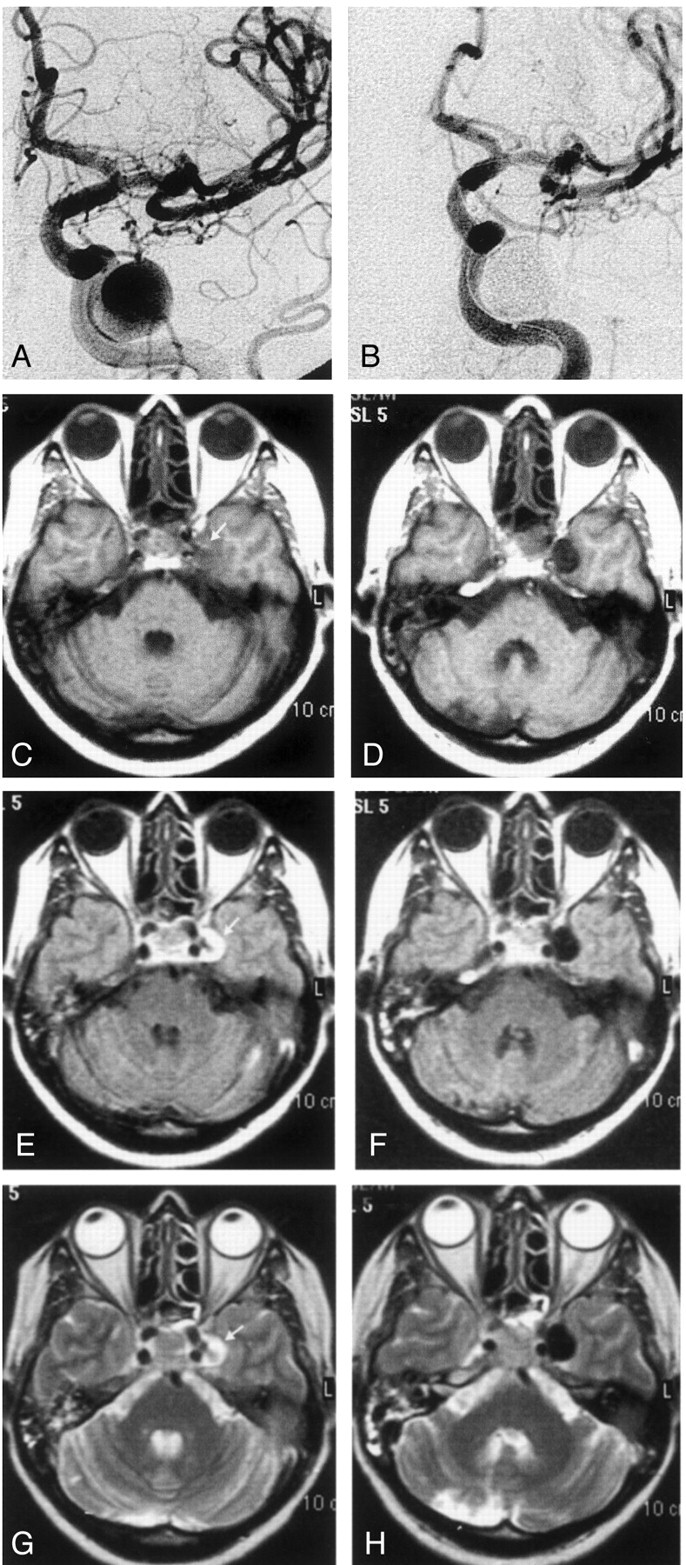
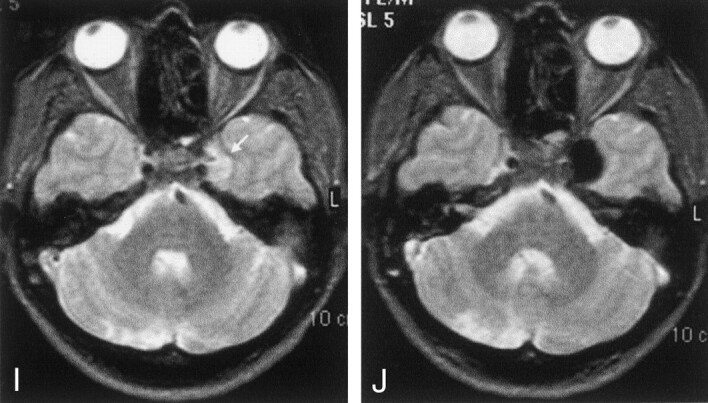
Fig 4.


A and B, Pre- and posttreatment angiograms demonstrating large ICA aneurysm occluded completely
C–J, Corresponding pre- and posttreatment T1-weighted (C, D), fluid-attenuated inversion recovery (E, F), turbo spin-echo (G, H), and GRE (I, J) T2-weighted MR images. On the pretreatment images, the left ICA aneurysm shows increased signal intensity due to slow flow (arrow, C, E, G, I). After it was filled with the polymer, the aneurysm appears homogeneously hypointense; the appearance resembles the signal void of a patent aneurysm.
