Abstract
BACKGROUND AND PURPOSE: Membrane constituents may play a key role in the magnetization transfer (MT) effect. In lamprey spinal cord, axonal diameters range from <1 μm in the dorsal region to 20–40 μm in the ventral region. There is a corresponding range of axonal, and hence cell membrane, density. These characteristics permit determination of the effect of cell membrane density on MT. The purpose of this study was to characterize regional MT effects in lamprey spinal cord.
METHODS: Excised spinal cords from eight sea lampreys were measured with a 9.4-T MR imaging system. MT saturation was applied for spin-echo sequences. The MT ratio (MTR) was calculated in each location (dorsal, lateral, and ventral columns). Spinal cords from five other lampreys were prepared with an antibody to lamprey glial keratin (LCM 29). The percentage of area staining with LCM29 was calculated for each location.
RESULTS: Mean MTR (± SD) for the dorsal, lateral, and ventral columns were 62.4 ± 4.2, 59.2 ± 2.7, and 56.9 ± 3.0, respectively; all differences were significant (P < .05). Mean LCM29-positive areas for the dorsal, lateral, and ventral columns were 85.1%, 69.7%, and 50.9%, respectively. MTR and percentage LCM29-positive area were significantly correlated (r2 = 0.98).
CONCLUSION: Regional differences in MT effect exist in the lamprey spinal cord. MTR is well correlated with percentage LCM29-positive area. These results support the hypothesis that membrane constituents are at least partly responsible for regional variations in MT effect.
Magnetization transfer (MT) can enhance tissue contrast and provide information regarding neural tissue composition on the basis of the exchange of 1H magnetization in free water and 1H in a pool with restricted motion (protons in proteins or macromolecules) (1, 2). The membrane constituents in the axolemmal lipid bilayer (e.g., cholesterol, sphingomyelin, and galactocerebroside) may play a key role in the MT effect in the nervous system (3–5).
In the spinal cord of the sea lamprey (Petromyzon marinus), axonal fiber diameters range from <1 to 40 μm, with individual giant reticulospinal axons (Müller and Mauthner axons) ranging from 10 to 40 μm in diameter (6). Glial fibers, which are thin and thus have a high volume density of surface membranes, fill most of the space between these axons, as shown in Figure 1. By studying normal lamprey spinal cords, which have a known distribution of axonal diameters ranging from <1 μm in the dorsal columns to 20–40 μm (Müller axons) in the ventral columns (6), we can determine the effect of cell membrane density on the basis of MT findings.
Fig 1.
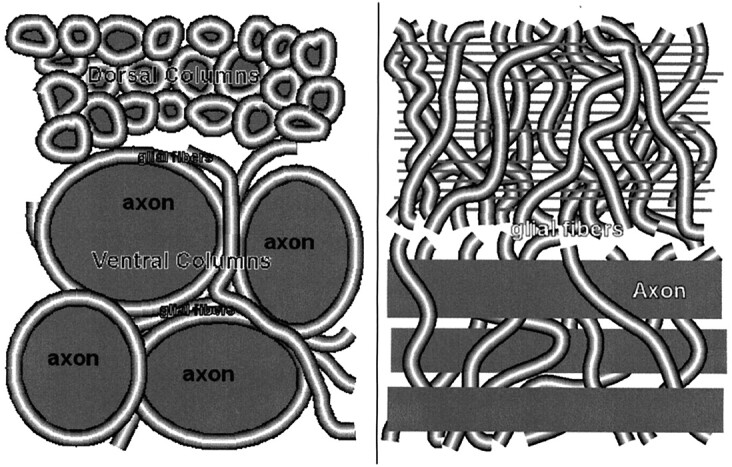
Transverse (left) and longitudinal (right) sections of lamprey spinal cord. Axonal fiber diameters range from <1 μm in the dorsal columns to 20–40 μm (Müller axons) in the ventral region. Glial fibers densely fill the space between axons.
We developed an MR microscopic method that can achieve 9-μm2 in-plane resolution in fixed, excised lamprey spinal cord (7) and 20-μm2 in-plane resolution in freshly excised lamprey spinal cord (8). In freshly excised samples, 20-μm2 in-plane resolution was used to reduce imaging time and thus avoid deterioration of the spinal cord. In this way, MT behavior could be observed in each cross-sectional location. The present study was undertaken to characterize regional MT effects in normal, living, excised lamprey spinal cord by means of MR microscopy at 12-μm2 resolution.
Methods
Animal Preparation
Procedures were approved by the Institutional Animal Care and Use Committee of the University of Pennsylvania. Larval sea lampreys, before transformation to the adult stage (4–5 years old, approximately 12 cm long), were obtained from a New Jersey stream and maintained in fresh water tanks at 16°C. Eight lampreys were anesthetized by using a solution of 0.1% tricaine methansulfonate for 3–5 minutes, and their spinal cords were removed. Excision and handling of the spinal cord is described in detail elsewhere (6–8). Briefly, the cords were excised in ice-cold Tris-buffered lamprey Ringer solution (110 mmol/L NaCl, 2.1 mmol/L KCl, 2.6 mmol/L CaCl2, 1.8 mmol/L MgCl2, and 10 mmol/L Tris buffer at pH 7.4). Each piece of excised cord was immobilized along a thread by using ligatures at both ends. The excised cord was immediately placed into a microcapillary tube (0.9-mm inner diameter) perfused with Ringer solution at 4°C. This well-characterized method of excision of the live cord has been used routinely in electrophysiological studies for many years. The isolated spinal cord survives at 4°C for several days and can be used in acute experiments, remaining electrically active at temperatures up to 12°C for many hours (9). After applying this method, no postmortem changes are demonstrated on histologic findings, even after MR imaging (8).
For immunohistology, excised spinal cords from five size-matched sea lampreys were fixed with 2% paraformaldehyde for 12 hours. The tissues were then dehydrated in serial ethanols and embedded in paraffin. Tissue blocks were cut from the middle of the excised cord. Transverse 10-μm paraffin sections were deparaffinized, dehydrated, and blocked in 2% fetal bovine serum. An antibody specific for lamprey glial keratin, LCM 29 (1:100 in 0.1 mol/L Tris and 2% fetal bovine serum) was applied to the sections and allowed to incubate at 4°C overnight in a humid chamber (10). In the lamprey, the glial intermediate filaments are composed of keratin rather than the glial fibrillary acidic protein of mammalian astrocytes (10). The primary antibody was labeled by using the avidin-biotin complex method, as described in the ABC kit (Biomedia, Foster City, CA). This was followed by metal-enhanced diaminobenzidine substrate (Pierce, Rockford, IL). The sections were counterstained with 0.05% toluidine blue for 10 minutes and dipped briefly in 0.05% eosin solution. Finally, the sections were dehydrated in serial ethanols, cleared in toluene, and mounted on glass slides.
Micro MR Imaging
MR imaging was performed with a 9.4-T microimaging system (DMX-400, Bruker Instruments, Karlsruhe, Germany). The microimaging accessory consisted of three-axis, self-shielded magnetic field gradients with a 100-G/cm (1000 mT/m) maximal gradient amplitude in all three channels. We used a homemade solenoid transmit-receive radiofrequency (RF) coil (7, 8) for micro-MR imaging. The RF probe is described in detail elsewhere (7). Briefly, a modified commercial probe head consisting of a 400-MHz solenoidal transmit-receive RF coil was tuned and impedance-matched via a standard capacitor network that interfaced with the RF transmit-receive chain of the spectrometer. (The coil had a 2.5-mm inner diameter, it was 6 mm long, and it contained seven turns of copper wire of 0.2-mm outer diameter.)
MR imaging was performed by using a conventional spin-echo (SE) sequence (TR/ TE/NEX, 4000/8.7/2; field of view, 3 mm; matrix, 256 × 256; section thickness, 0.25 mm) yielding 12 × 12-μm in-plane resolution in an imaging time of 34 minutes. A single transverse section was selected. MT saturation was achieved with a single block pulse of 40-μT power and 3.9-second duration applied 6500 Hz off resonance. Diffusion-weighted SE MR images emphasize the anatomic structure of the lamprey spinal cord (8); therefore, diffusion gradients were applied (Δ = 12.58 ms, δ = 6 ms), with a b value of 1767 s/mm2 by using the same geometry as that of MT images. Other parameters for diffusion-weighted SE MR imaging were 1000/25.3/4, resulting in an imaging time of 17 minutes. Throughout all imaging sessions, the temperature of the specimen was maintained at 8°C.
MR Data Analysis
The regions of interest (ROIs) were placed on SE images with MT and without MT to measure the signal intensities in each location (dorsal, lateral, and ventral portions and also the surrounding buffer). Signal intensities of the inside of a single giant Mauthner axon were also measured for reference. Signal intensities were measured in the background to provide noise-corrected signal intensities (11). The MT ratio (MTR) was computed as follows: [buffer water (Msat/M0) − tissue (Msat/M0)] × 100, where M0 is the signal intensity without the MT pulse, and Msat is the signal intensity with the MT pulse applied. In the dorsal, lateral, and ventral portions, MTRs of both sides were averaged to produce the value of each location.
Analysis of Immunohistochemical Stains for Glial Keratin
For each location, the percentage of positive LCM29 staining was defined as the region that stained positively for LCM29 divided by the whole area of the histologic field × 100 (by using a ×40 objective lens). NIH Image (version 1.62 for Macintosh, National Institutes of Health, Bethesda, MD) was utilized for this analysis. After the threshold between the negatively staining axonal area and positively staining glial-cell area was selected, the image was converted to a binary image. Finally, the percentage area staining positively with LCM29 was calculated. To minimize individual variation, two researchers (H.U., A.P.) independently determined the threshold in each location to produce the percentage of positive LCM29 staining for each location. Then, the values set by each researcher were averaged.
Statistical Analysis
All MTR values were expressed as the mean ± SD. Differences among the three regions (dorsal, lateral, and ventral portions) were evaluated by using a two-tailed analysis of variance with the Tukey-Kramer multiple-comparison test. Statistical analysis was performed by using JMP IN software (SAS Institute, Cary, NC), for which a P value of <.05 indicated a statistically significant difference.
Results
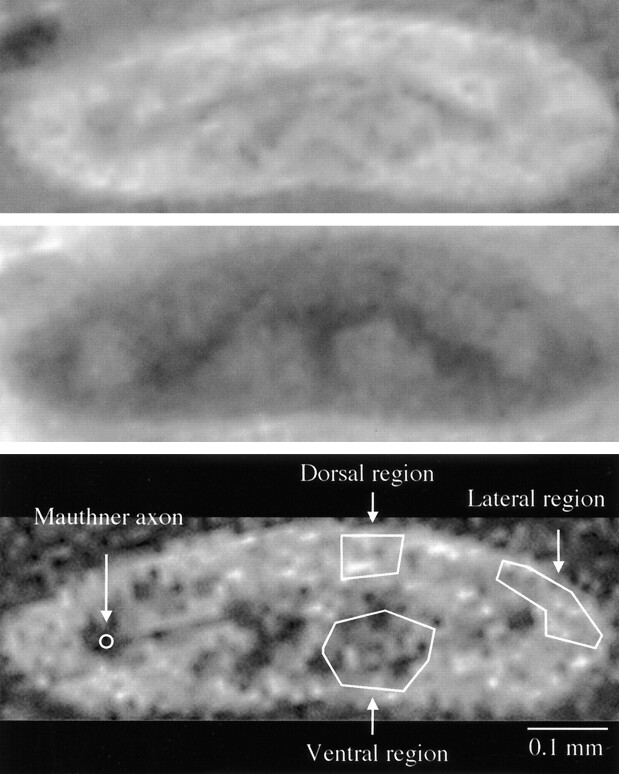
In all cases, MR images were sufficient to place ROIs in each location, as shown in Figure 2. The solitary Mauthner axons just lateral to the gray matter, the Müller axons in the ventral columns, and the gray matter were visualized as low-signal-intensity areas on the MT off-SE images. These structures were more clearly delineated on diffusion-weighted images. Therefore, ROIs were placed on the SE images corresponding to the diffusion-weighted images.
Fig 2.
Transverse micro-MR images of normal live excised spinal cord without (top) and with (middle) MT. Bottom image is a diffusion-weighted SE image with the same geometry as that of the SE images. Overlaid ROIs (bottom) were used to calculate the MTR on the corresponding SE images.
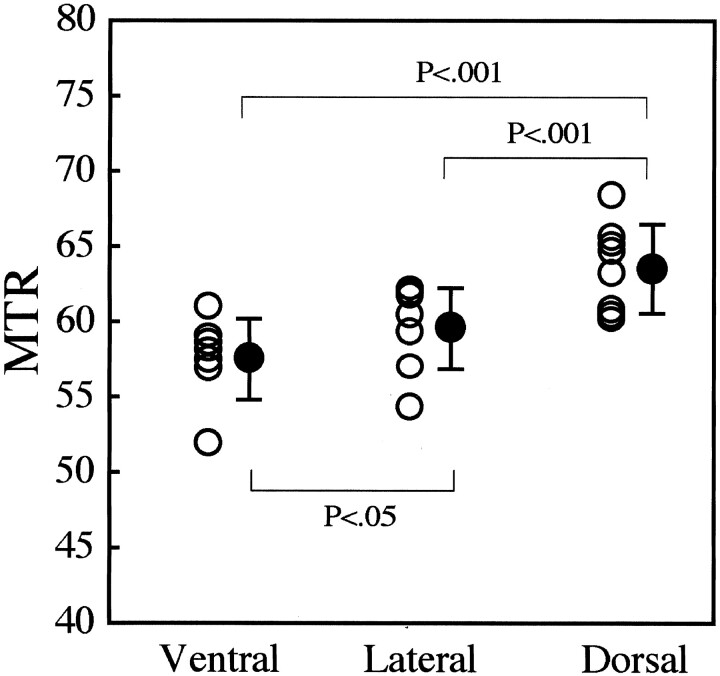
Mean MTR varied according to region. MTRs for the dorsal, lateral, and ventral columns were 62.4 ± 4.2, 59.2 ± 2.7, and 56.9 ± 3.0, respectively. The mean MTR of the inside of a Mauthner axon was 49.9 ± 6.9 (available in three cases). The mean MTR of the dorsal columns was significantly greater than those of the lateral (P < .001) and ventral (P < .001) columns. The mean MTR of the lateral columns was significantly greater than that of the ventral columns (P < .05). These results are summarized in Figure 3.
Fig 3.
Regional MTRs in lamprey spinal cord. Values were used in the Tukey-Kramer multiple-comparison test to determine statistical significance. MTRs for each location are plotted with open circles. Closed circles are mean MTRs ± SDs.
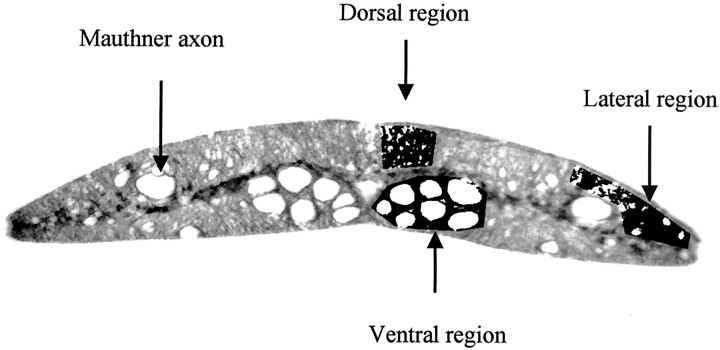
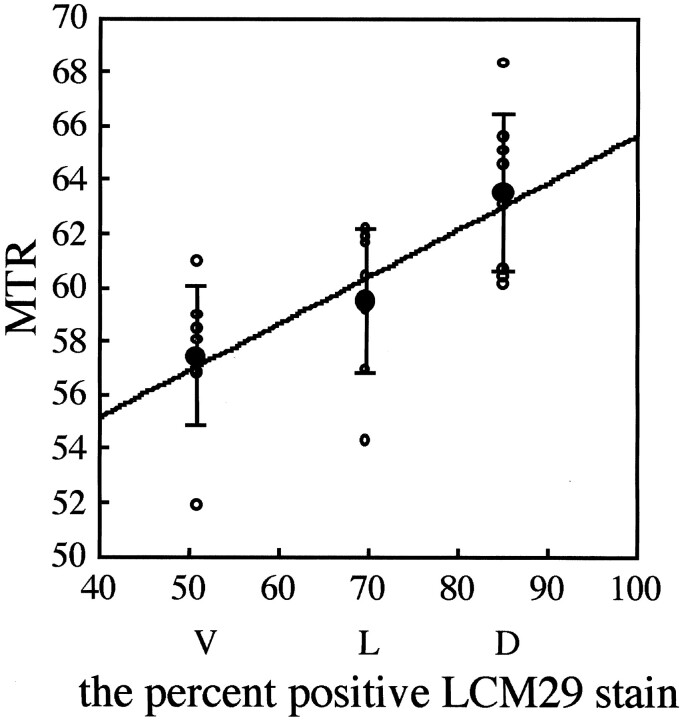
Figure 4 shows representative immunohistochemical sections obtained from similar locations in other lampreys to calculate the percentage of LCM29-positive staining. The overlaid ROIs were used to calculate this percentage for each location on the corresponding MT images. Mean percentages of positive staining for the dorsal, lateral, and ventral regions were 85.1%, 69.7%, and 50.9%, respectively. A significant correlation was found between the MTR, as determined by micro-MR imaging, and the percentage of LCM29-positive staining, as determined by immunohistochemical analysis (r2 = 0.98; Fig 5).
Fig 4.
Immunohistochemical section at a location similar to that in Figure 2 (LCM29 stain for glial keratin; original magnification, ×10). Axonal fiber diameters are 1–40 μm. Individual giant reticulospinal axons are located in the lateral region (Mauthner axon) and ventral columns (Müller axons). In the fiber tracts, spaces not occupied by axons are filled with glial cells and their processes. Threshold between negatively stained area (axoplasm) and positively stained area (glial cells and fibers) is selected manually. Image is converted to a binary image, as shown. Average of two threshold determinations is displayed in overlay regions in the areas measured. Percentage of positive staining is calculated in dorsal, lateral, and ventral columns. The Mauthner axon is not included in the lateral columns sampled for MTR measurement.
Fig 5.
Percentage of LCM29-positive area on immunohistochemical analysis versus MTR on MR imaging. Open circles indicate MTRs; closed circles, mean MTR ± SD; D, dorsal region; L, lateral; and V, ventral. Mean MTR and percentage LCM29-positive area are significantly correlated (r2 = 0.98).
Discussion
To our knowledge, this is the first report focusing on the regional MT dependency in the spinal cord of the lamprey by using the 9.4-T MR system. The mean MTR of the dorsal columns was significantly greater than that of the lateral and ventral columns. The mean MTR of the lateral columns was significantly greater than that of the ventral columns. The regions analyzed by immunohistochemical staining for glial cell protein showed distinct differences in their anatomic structure, with a larger LCM29-positive area percentage in the dorsal column and a lower percentage in the ventral columns. The percentage in the lateral columns was between these two extremes. MTR (dorsal > lateral > ventral) was well correlated with this percentage (Fig 5). As shown in Figures 1 and 6, the glial fibers separating the axons are thin. Therefore, LCM29 staining represents areas with a high density of glial cell membranes. These regions are also the locations where axons have small diameters (i.e., high ratios of surface membrane to volume). Thus, areas of high LCM29 staining have high densities of cell membranes, both glial and axonal. Consequently, the strong correlation between the percentage of LCM29 staining and the MTR supports our hypothesis that membrane constituents may be responsible for the variation in the MT effect.
Fig 6.
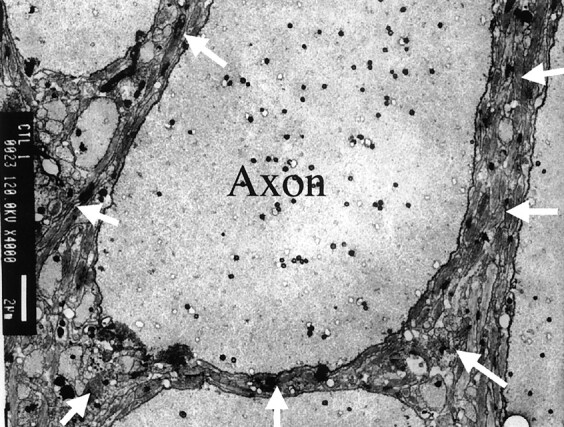
Electron photomicrograph from the lateral column of normal lamprey spinal cord. Darkly staining glial fibers (arrows) densely fill spaces between axons, which are less darkly stained. Shown are axons of varying size, including one (Axon) approximately 13 μm in diameter. Bar indicates 2 μm.
We were able to place ROIs inside the Mauthner axons in three samples. Although the voxel was 12 × 12 × 250 μm, these axons were not clearly identified on MT-off and MT-on SE images in five other samples. The Mauthner axons from these images were likely to have significant partial volume effects; therefore, the MTR of the inside of these axons were included only from those samples in which we could make a reliable measurement. Nevertheless, the mean MTR of the inside of a Mauthner axon was 49.9 ± 6.9 (based on the three satisfactory samples). Although our sample was too small for statistical analysis, the mean MTR inside these axons was lower than—and out of the range of—the MTR in regions of spinal cord spanning multiple axons. This smaller MTR may arise because it does not include any cell membranes. Thus, the low MTR in the Mauthner axon also supports the hypothesis that cell membranes account for a substantial portion of the regional variations in MTR.
A variety of degenerative and reparative processes occur after spinal cord injury. One striking morphologic change is a loss of axon fibers. This reduction in axon density most profoundly affects larger-diameter fibers, and it is proportional to the severity of injury. Current research and findings from early clinical trials suggest that therapies intended to ameliorate axonal loss after injury may have an increasing role in the treatment of spinal cord trauma. However, conventional MR imaging cannot be used to measure axonal density in the spinal cord. We propose that MT measures and their change over time after injury may provide useful indicators of axonal density. If confirmed, this would improve initial assessments of injury severity, permit monitoring of axonal loss in response to trauma, and allow for the measurement of therapeutic effects on the rate of axonal loss and recovery.
Conclusion
A regional MT effect was demonstrated in living excised spinal cord of the sea lamprey by using MR-microscopic techniques. The results support our hypothesis that membrane constituents may be responsible for this variation in the MT effect. These results in normal lampreys suggest that MTR may be useful in the study of axonal degeneration and regeneration following spinal cord transection in lampreys and ultimately in human patients with spinal cord injury.
Footnotes
Supported by National Institutes of Health grants R01 NS4180, R01 NS25921, R01 NS14837, and R01 NS25581.
References
- 1.Balaban RS, Ceckler TL. Magnetization transfer contrast in magnetic resonance imaging. Magn Reson Q 1992;8:116–137 [PubMed] [Google Scholar]
- 2.Henkelman RM, Stanisz GJ, Kim JK, Bronskill MJ. Anisotropy of NMR properties of tissues. Magn Reson Med 1994;32:592–601 [DOI] [PubMed] [Google Scholar]
- 3.Kucharczyk W, Macdonald PM, Stanisz GJ, Henkelman RM. Relaxivity and magnetization transfer of white matter lipids at MR imaging: importance of cerebrosides and pH. Radiology 1994;192:521–529 [DOI] [PubMed] [Google Scholar]
- 4.Wolff SD, Balaban RS. Magnetization transfer contrast (MTC) and tissue water proton relaxation in vivo. Magn Reson Med 1989;10:135–144 [DOI] [PubMed] [Google Scholar]
- 5.Fralix TA, Ceckler TL, Wolff SD, Simon SA, Balaban RS. Lipid bilayer and water proton magnetization transfer: effect of cholesterol. Magn Reson Med 1991;18:214–223 [DOI] [PubMed] [Google Scholar]
- 6.Selzer ME. Variability in maps of identified neurons in the sea lamprey spinal cord examined by a wholemount technique. Brain Res 1979;163:181–193 [DOI] [PubMed] [Google Scholar]
- 7.Wright AC, Wehrli SL, Zhang G, et al. Visualization of individual axons in excised lamprey spinal cord by magnetic resonance microscopy. J Neurosci Methods 2002;114:9–15 [DOI] [PubMed] [Google Scholar]
- 8.Takahashi M, Hackney DB, Zhang G, et al. Magnetic resonance microimaging of intraaxonal water diffusion in live excised lamprey spinal cord. Proc Natl Acad Sci U S A 2002;99:16192–16196 [DOI] [PMC free article] [PubMed] [Google Scholar]
- 9.Mackler SA, Selzer ME. Specificity of synaptic regeneration in the spinal cord of the larval sea lamprey. J Physiol 1987;388:183–198 [DOI] [PMC free article] [PubMed] [Google Scholar]
- 10.Merrick SE, Pleasure SJ, Lurie DI, Pijak DS, Selzer ME, Lee VM. Glial cells of the lamprey nervous system contain keratin-like proteins. J Comp Neurol 1995;355:199–210 [DOI] [PubMed] [Google Scholar]
- 11.Miller AJ, Joseph PM. The use of power images to perform quantitative analysis on low SNR MR images. Magn Reson Imaging 1993;11:1051–1056 [DOI] [PubMed] [Google Scholar]


