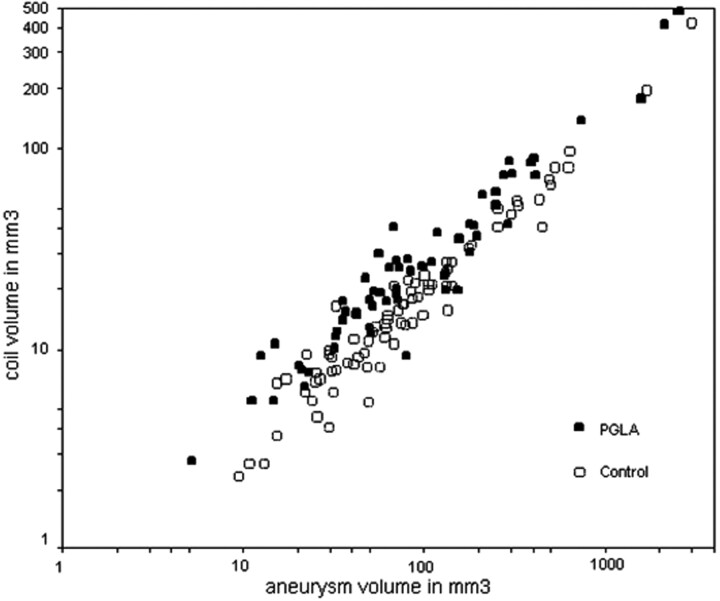
Fig 4.
Relationship between coil volumes and aneurysm volumes. Graph shows a linear relationship between the aneurysm volumes and the coil volumes in either group. Coil volume and aneurysm volume are expressed in logarithmic scales. Overall spots of the PGLA-coil group are located higher than those of control group.

