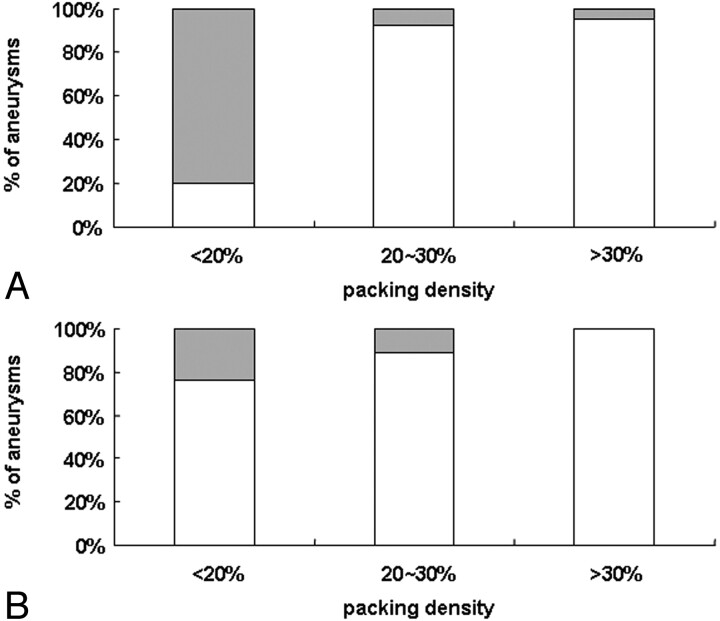
Fig 7.
Recanalization rate according to packing attenuation group in PGLA-coil group (A, P = .0016) and bare-coil group (B, P = .0837). Gray bars represent percentages of aneurysms showing recanalization and white bars those showing stable occlusion at follow-up imaging. With increasing packing densities less percentage of aneurysms become recanalized in either group (χ2 test for trend).

