
Fig 2.
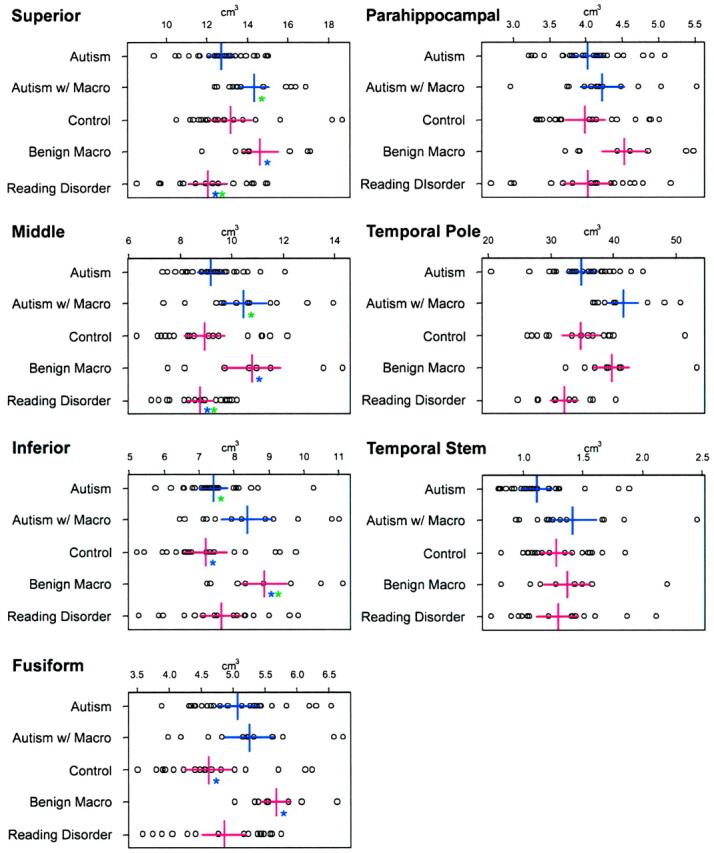
Parenchymal gyral volumes of the temporal lobe, volume of the temporal lobe tip, and white matter stem. Each box contains the actual data point representing the uncorrected volume for each structure. The five groups are represented on the y axis. The x axis is in cm3. Colored asterisks indicate where significance (P < .05) is present and between which groups the significance resides (ie, same color). For example, in the superior temporal gyrus panel in the upper left, the two blue asterisks indicate that subjects with reading disorder had smaller volume than that of the control subjects with benign macrocephaly (Macro). Note that there are basically no significant differences between autistic and control subjects with normal head size or between autistic and control subjects with large head size. The only comparisons that were significant were between one of the macrocephalic groups and the normocephalic groups.