
Fig 3.
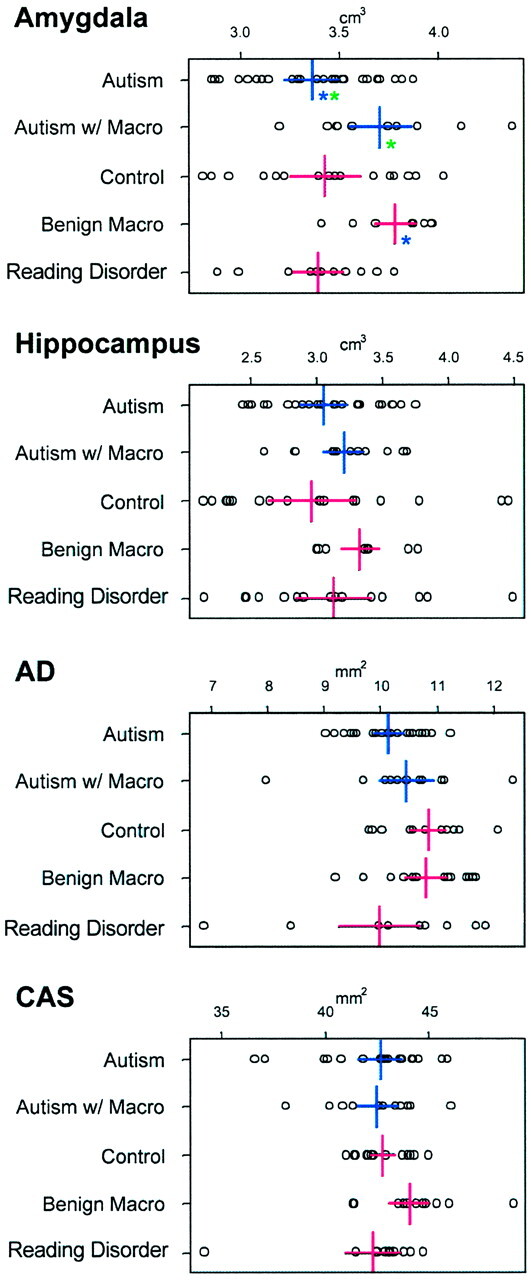
Volumetric comparisons of subcortical regions of the temporal lobe including the amygdala, total hippocampal volume, area dentata (AD), and the CA1-CA3 region plus subiculum (CAS) of the hippocampus. Legend is otherwise the same as that in Figure 2. Note that AD and CAS values are in mm2 as they represent the surface area at that level.