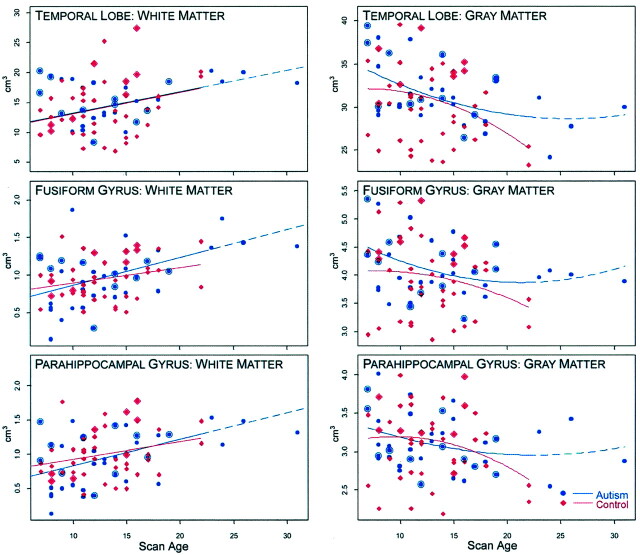
Fig 4.
Growth plots by age for total temporal lobe white matter and gray matter, fusiform gyrus white and gray matter, and parahippocampal gyrus white and gray matter. Controls include typically developing subjects with or without macrocephaly, and subjects with reading disorder. The nature of the relationship of structure, development, and age was tested by either a linear or quadratic fit. As can be seen for all white matter structures, the better fit was linear. For gray matter structures, the fit was quadratic. The dash-line represents the extension of the quadratic for the autistic subjects older than 23 years. Since there were no controls to compare beyond that age, the actual regression line stops with the solid line and the projected regression is represented by the dash. None of these growth plots were significantly different, indicating generally similar growth patterns between autistic and control subjects, even though the curves showed some differences. Large blue ‘bulls eye’ points denote macrocephalic (both selected and unselected) autistic subjects, and the large red diamonds indicate macrocephalic control subjects. Age is shown on the x axis and volume (cm3) on the y axis.

