Abstract
BACKGROUND AND PURPOSE: Recent findings suggest that diffusion-weighted imaging might be an important adjunct to the diagnostic workup of disease processes in the spine, but physiological motion and the challenging magnetic environment make it difficult to perform reliable quantitative diffusion measurements. Multi-section line scan diffusion imaging of the spine was implemented and evaluated to provide quantitative diffusion measurements of vertebral bodies and intervertebral disks.
METHODS: Line scan diffusion imaging of 12 healthy study participants and three patients with benign vertebral compression fractures was performed to assess the potential of line scan diffusion imaging of the spinal column. In a subgroup of six participants, multiple b-value (5–3005 s/mm2) images were obtained to test for multi-exponential signal decay.
RESULTS: All images were diagnostic and of high quality. Mean diffusion values were (230 ± 83) × 10−6 mm2/s in the vertebral bodies, (1645 ± 213) × 10−6 mm2/s in the nuclei pulposi, (837 ± 318) × 10−6 mm2/s in the annuli fibrosi and ranged from 1019 × 10−6 mm2/s to 1972 × 10−6 mm2/s in benign compression fractures. The mean relative intra-participant variation of mean diffusivity among different vertebral segments (T10-L5) was 2.97%, whereas the relative difference in mean diffusivity among participants was 7.41% (P < .0001). The estimated measurement precision was <2%. A bi-exponential diffusion attenuation was found only in vertebral bodies.
CONCLUSION: Line scan diffusion imaging is a robust and reliable method for imaging the spinal column. It does not suffer as strongly from susceptibility artifacts as does echo-planar imaging and is less susceptible to patient motion than are other multi-shot techniques. The different contributions from the water and fat fractions need to be considered in diffusion-weighted imaging of the vertebral bodies.
Diffusion-weighted imaging provides unique contrast information that is complementary to the information provided by conventional MR imaging and is sensitive to microstructural changes far beyond the resolution of conventional MR imaging techniques. During the last decade, diffusion-weighted imaging has become a reliable method, which is now used on a routine basis, to detect acute cerebral ischemia (1, 2). Recent findings suggest that diffusion-weighted imaging is also of particular interest in the diagnostic workup of lesions in intervertebral disks and the spinal column, for which conventional MR imaging findings are often nonspecific. On the basis of differences in proton mobility within the cellular matrix, diffusion-weighted imaging has been suggested to be of particular usefulness in the evaluation of vertebral lesions, such as benign compression fractures, metastases, and hemangiomas (3–7). Also, changes in diffusion are thought to be an early indicator of disk degeneration and a precursor of disk herniations (8, 9).
Physiological motion and magnetic susceptibility variations around the spine are significant and, thus, make it very challenging to acquire robust diffusion images with sufficient spatial resolution and within a reasonable acquisition time. Line scan diffusion imaging might therefore be advantageous for imaging the spine, because it is inherently less sensitive to motion than are regular 2D Fourier imaging techniques and is able to produce diffusion maps without the use of restraining or gating mechanisms (10). Moreover, line scan diffusion imaging does not require high slew rate gradient hardware and can be implemented even on imagers with conventional gradient systems.
The scope of this study was therefore to assess the potential strengths and weaknesses of the line scan diffusion imaging method for imaging the spinal column, to provide reliable quantitative diffusion measurements of healthy participants, and to test whether a multi-exponential course of diffusion (11) could be obtained in vertebral bodies and intervertebral disks.
Methods
Line scan diffusion imaging of 12 healthy volunteers (five female and seven male participants; mean age, 32.4 ± 6.85 years) was performed on a 1.5-T whole body system (Signa LX 8.5; GE Medical Systems; Milwaukee, WI) (40 mT/m maximum gradient strength). For signal intensity reception, the vendor’s standard six-element spine phased array coil was used, which allows one to operate four of the six array coils simultaneously and to reconstruct a sum-of-squares image from the four intermediate coil images. Written informed consent was obtained after the nature of the procedure had been fully explained to each participant. All procedures were approved by the Stanford Institutional Review Board.
The line scan diffusion imaging sequence was able to perform multi-section acquisitions and was adapted for imaging the spine by using diffusion sensitivities of b0 = 5 and b1 = 650 s/mm2, where b = (γδG)2 (Δ − δ/3), γ is the proton gyromagnetic ratio, G is the magnitude of the diffusion-encoding gradients, δ is the duration of each diffusion-encoding gradient (11.4 ms), and Δ is the time interval between the leading edges of the diffusion-encoding gradients (19.4 ms). To achieve optimal signal-to-noise ratio per unit imaging time, the diffusion-weighting gradients were played out according to the tetrahedral diffusion-encoding scheme along four different directions: (1, 1, 1)T, (−1, −1, 1)T, (−1, 1, −1)T, and (1, −1, −1)T. The tetrahedral encoding provided a larger effective gradient strength at the cost of an additional diffusion direction compared with regular orthogonal encoding. For a given b value, however, the resulting TE is much shorter with tetrahedral encoding and thus leads to a much better signal-to-noise ratio. The trace of the diffusion tensor can be calculated from the tetrahedral measurements, as shown elsewhere (12).
The other line scan diffusion imaging parameters were as follows: field of view, 67.5 × 270 mm; acquisition matrix, 128 × 256; section thickness, 6 mm; skip, 0; 1900, 149/39.2/6 (TReff, line-to-line TR/TE/NEX); number of sections, three; and receiver bandwidth, ±15.63 kHz. The total acquisition time was 6 minutes 33 seconds. To minimize T1 weighting, the excitation of lines was interleaved (ie, every nth adjacent line was excited during one sweep). The line-to-line TR was, in this context, the time between line excitations, whereas the effective TR, or sweep TR, was the time between the excitation of two adjacent lines (ie, the time within which the line excitation sweeps once across the image plane and one sweep is completed).
Image reconstruction to a 256 × 256 matrix was performed off-line by using a remote workstation and included both missing line interpolation and unwarping of eddy current-induced distortions along the readout direction. From those reconstructions, maps of the third of the trace of the diffusion tensor were generated and served for quantitative diffusion measurements. Regions of interest were drawn in each of the vertebral bodies between the 10th thoracic (T10) and the fifth lumbar (L5) vertebral body and in the nuclei pulposi and the annuli fibrosi of the intervertebral disks that were located between those segments. The region of interest outlining was performed on a consensual basis among three readers (R.B., A.M.H., R.W.P.) by using the calculated parameter maps. Compact bone and vessels, which were identifiable either on the line scan diffusion images or on accompanying conventional T1- and T2-weighted fast spin-echo images were excluded. All region of interest measurements were grouped on either a per-participant or per-vertebral body basis. Statistical analysis was conducted by using a randomized block design method. The measurement precision was estimated by imaging one participant at four different points in time.
In a subset of six volunteers, additional diffusion measurements were performed at different levels of diffusion weighting to test the hypothesis of bi-exponential decay in the vertebral bodies, the annuli fibrosi, and the nuclei pulposi. In this context, a slow-exchange model S(b) = S0(f exp(−b D1) + (1 − f) exp(−bD2)) was applied. Ten linearly increasing b factors (5, 338, 672, …, 2672, and 3005 s/mm2) were used. To account for the lower signal-to-noise ratio at higher b values, the number of averages was increased to 12 for b values >1500 s/mm2. To achieve the higher b value, the TE was increased to 65.
The magnitude averaging of complex MR signals in the low signal-to-noise ratio regime can, if uncorrected, strongly bias the magnitude of the diffusion-weighted signal. Therefore, the nonlinear least squares fitting process was modified to account for the contribution from the Rice-Nakagami noise distribution (13). Finally, the χ2 values obtained from fits using a mono-exponential decay model were compared with corresponding results obtained using the bi-exponential model. The χ2 value was the sum of squared differences between the fitted model and the sampled data points and served as a measure for the goodness of fit. The nonparametric Wilcoxon signed rank test was used to test whether the distribution of differences between pairs of χ2 values from mono- and bi-exponential fits in each participant is symmetric around zero (= null hypothesis).
Results
Although no cardiac gating or other restraining measures were applied, the line scan diffusion images were of excellent quality and revealed virtually no motion artifacts. Missing lines were found only in the large vessels anterior to the spinal column or in other structures outside the spine, which showed excessive movement. Figure 1 shows an example for the good image quality of spinal line scan diffusion imaging in a female volunteer.
Fig 1.
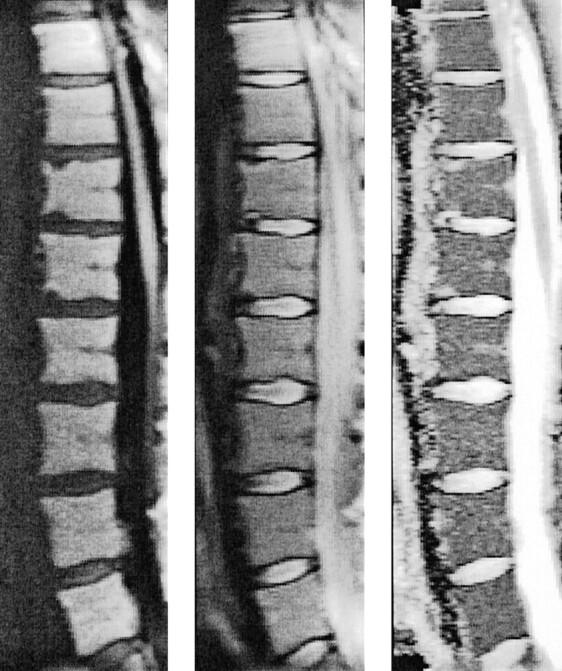
Sagittal line scan diffusion images of the spine of a 28-year-old female volunteer. Line scan diffusion image with diffusion coding (left, b = 650 s/mm2) and without diffusion coding (middle, b = 5 s/mm2) are shown together with the corresponding map of the mean diffusion coefficient (right). No ghosting artifacts or missing lines are apparent. Note the strong diffusion difference between the intervertebral disks and the vertebral bodies.
The measurements of intra-participant variability of the mean diffusivity over all vertebral segments revealed a variation coefficient of 2.97% in vertebral bodies, 4.48% in nuclei pulposi, and 12.41% in the annuli fibrosi. Considering all segments from T10 to L5, the relative difference in mean diffusivity among participants was moderate (7.41%) for the vertebral bodies, whereas for nuclei pulposi (8.80%) and annuli fibrosi (15.33%), these fluctuations were considerably higher. The estimated measurement precision was found to be <2%. For all regions of interest measured in vertebral bodies, annuli fibrosi, or nuclei pulposi, analysis of variance showed that the inter-participant variations were significantly higher than the intra-participant diffusion changes (P < .0001). Corresponding absolute values of mean diffusion were (230 ± 83) × 10−6 mm2/s (vertebral bodies), (1645 ± 213) × 10−6 mm2/s (nuclei pulposi), and (837 ± 318) × 10−6 mm2/s (annuli fibrosi) and were in agreement with those of previous studies (7, 14, 15).
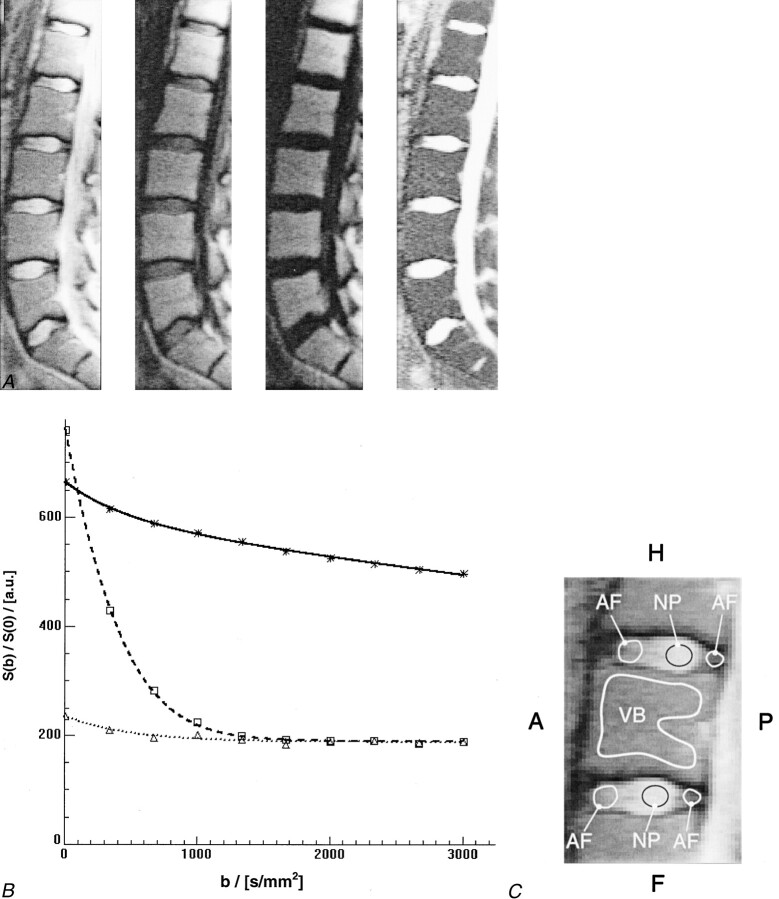
Figure 2A shows the contrast changes for different levels of diffusion weighting. Figure 2B shows the corresponding signal intensities over the range of b vales used for representative regions of interest (Fig 2C). Note that the diffusion-weighted signal in the liquid-rich nuclei pulposi decays rapidly, whereas the signal intensity remains almost unchanged for normal bone marrow because of the low diffusion coefficient. Despite the rapid signal decay, the signal intensity of the nuclei pulposi does not drop to zero. The latter is most likely because of the nonzero mean Rice-Nakagami distribution of the MR magnitude signal intensity in the low signal-to-noise ratio regime. Overall, a significant difference between the values obtained from mono- and bi-exponential fits was found (P < .005) for all three types of tissue. Although the signal intensity for annuli fibrosi and nuclei pulposi followed a mono-exponential course that converges asymptotically to the expectation value of the Rice-Nakagami distribution, the diffusion-weighted signal in vertebral bodies clearly showed a bi-exponential behavior far above the noise level. The mean diffusivities found for annuli fibrosi and nuclei pulposi were (753 ± 275) × 10−6 mm2/s and (1762 ± 193) × 10−6 mm2/s, respectively. The mean values found for the slow and fast mean diffusivity in vertebral bodies were (65 ± 21) × 10−6 mm2/s and (1551 ± 297) × 10−6 mm2/s. The slowly diffusing fraction was 89.9 ± 1.97%.
Fig 2.
Contrast changes and corresponding signal intensities over the range of b values used for representative regions of interest for different levels of diffusion weighting.
A, Three of 10 line scan diffusion images with different levels of diffusion weighting. From left to right: line scan diffusion images with a diffusion attenuation of b = 5672, and 3005 s/mm2 and corresponding map of the mean diffusion coefficients. Although the signal intensity in the intervertebral disks decays rapidly, the signal intensity in the vertebral bodies remains almost unchanged.
B, Course of diffusion-weighted signal for region of interest measurements in an intervertebral disk and a vertebral body. The plot shows the mean values for the region of interest measurements at different b levels for vertebral body (asterisks), nucleus pulposus (squares), and annulus fibrosus (triangles) and the corresponding fitted models (continuous curves). The effect of the non-Gaussian noise distribution of magnitude MR images is best seen on the fit for nucleus pulposus and annulus fibrosus. Instead of continuous signal decay, the curve levels off asymptotically. A conventional least squares fit would be strongly biased toward lower values of diffusion if the high b-value data points had been used.
C, Magnified view of the vertebral segment shown in A shows example regions that were considered for region of interest analyses of vertebral body (VB), nucleus pulposus (NP), and annulus fibrosus (AF). A, anterior; P, posterior; H, head; F, feet.
Figure 3 shows one example of diffusion-weighted images and corresponding apparent diffusion coefficient maps of a female patient with multiple histologically proved benign vertebral compression fractures. Figure 4 shows another female patient with a biopsy-proved hemangioma, with lesions at almost every level in the spine. In all patients, these lesions were highly conspicuous on the parameter maps because of their markedly elevated diffusivity. The mean diffusion values measured in the regions from which specimens for histologic examinations were obtained after MR imaging ranged from 1019 × 10−6 mm2/s to 1972 × 10−6 mm2/s.
Fig 3.
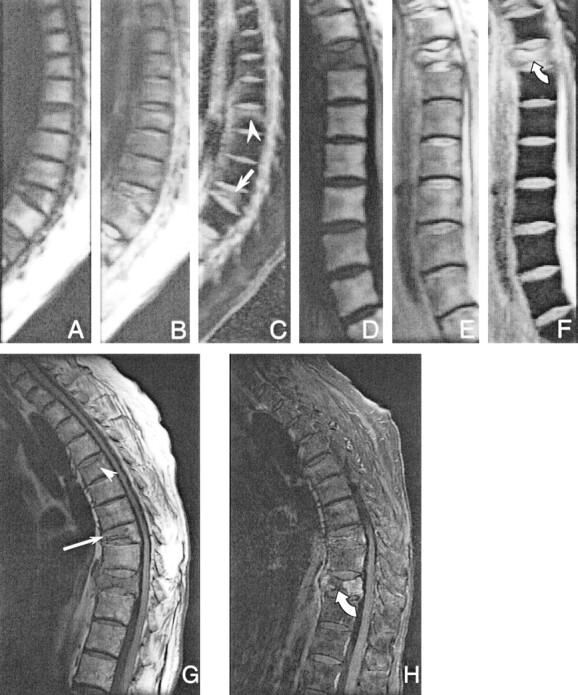
Line scan diffusion images of one of the female patients with multiple acute histologically proved benign compression fractures in the thoracic spine (T8 [arrow, mean diffusivity = (1376 ± 264) × 10−6 mm2/s]; T10 [curved arrow]; and the compression fracture of the end plate of T5 [arrowhead, mean diffusivity = (829 ± 59) × 10−6 mm2/s]). Two separate imaging sessions were required to cover the entire spine of this patient because of kyphosis. To image the upper part of the spine, the imaging plane had to be rotated around the left-right axis so that the readout dimension of the line scan diffusion image aligns with the spinal column.
A, Isotropic diffusion-weighted image of the upper spine.
B, Unweighted image of the upper spine.
C, Map of the mean diffusion coefficient of the upper spine.
D, Isotropic diffusion-weighted image of the lower spine.
E, Unweighted image of the lower spine.
F, Map of the mean diffusion coefficient of the lower spine.
G, Corresponding conventional sagittal T1-weighted spin-echo image. The extent of pathologic signal alteration is consistent with that seen on the line scan diffusion images. Only faint signal intensity changes are seen in the fractured end plate of T5 (arrowhead), whereas on the map of the mean diffusion coefficient, the abnormalities in this vertebral body can be more clearly delineated. The signal intensity changes of the compression fracture in T8 (arrow) correspond with hyperintensities in the diffusion coefficient maps.
H, Corresponding conventional sagittal T1-weighted spin-echo image with fat suppression. A biopsy specimen was obtained in the center of the lesion in T10 (curved arrow). The mean diffusivity was markedly higher [(1972 ± 145) × 10−6 mm2/s] than that of the anterior aspect [(1764 ρ 287) υ 10−6 mm2/s]. The extent of pathologic signal intensity alteration is consistent with that seen on the line scan diffusion images.
Fig 4.
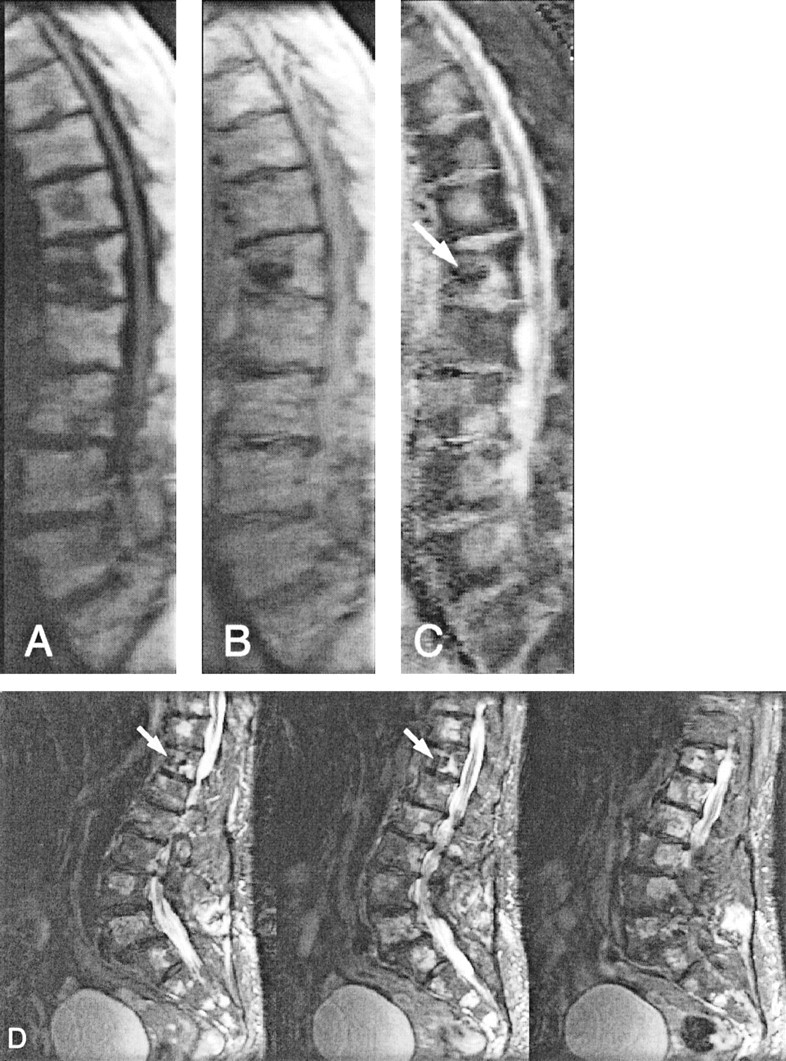
Line scan diffusion images (A–C) and fast spin-echo image (D) of an 85-year-old female patient with multiple hemangioma lesions at almost every level in the spine. The mean diffusivity measured in these lesions ranged from 1019 × 10−6 mm2/s to 1321 × 10−6 mm2/s. At the T12 level (arrows), vertebroplasty had been performed previously by injection of polymethylmethacrylate and, as expected, the diffusion coefficient was low (204 ± 123 × 10−6 mm2/s).
Discussion
Quantitative diffusion measurements of the spinal column are crucial to enable a reproducible assessment of pathologic abnormalities and might eventually facilitate the differentiation among different types of lesions. Because of several factors, however, diffusion-weighted imaging of the spine is challenging and only a few diffusion-weighted imaging studies of vertebral bodies have been performed. To some extent, the results and conclusions have been controversial (3–6, 16). Many diffusion MR imaging techniques, such as single shot echo-planar imaging, are not useful for imaging the spine because of the inhomogeneous magnetic environment and the high lipid content of the vertebral bodies that can lead to strong geometric distortions and chemical shift artifacts. Moreover, spectral selective lipid suppression, as it is routinely used in brain studies, can be incomplete, especially in regions with strong B0 variability, such as the cervicothoracic junction (17, 18). Because line scan diffusion imaging is known from other studies to be a very robust method for diffusion-weighted imaging (19, 20), we set out to study the potential strengths and weaknesses of this technique when applied to the vertebral column and attempted to provide absolute diffusion values for healthy participants and patients.
Line scan diffusion measurements of the spinal column provided images with adequate quality and within reasonable imaging time. Line scan diffusion imaging of the lumbar spine and parts of the thoracic spine was successfully performed. The results showed that the quality of diffusion-weighted imaging unequivocally benefited from the relative motion insensitivity of line scan diffusion imaging. In this context, line scan diffusion imaging was most ideally suited for imaging the spine, because the rectangular field of view (25% in our case) of a sagittally oriented line scan diffusion image ideally fits the aspect ratio of the spinal column. In addition, this shortened the overall imaging time substantially, and moving structures anterior to the spine (eg, the heart, intestines) did not affect the quality of the line scan diffusion imaging examination. The lower signal-to-noise ratio of line scan diffusion imaging, relative to that of conventional Fourier imaging, was ameliorated in part by increasing the number of signal averages and a relatively low receiver bandwidth. This measure, in turn, brought some sensitivity to off-resonant spins back into play. Nonetheless, these artifacts are less severe than with single shot echo-planar imaging and occur only as pixel shifts along the readout direction, which make them easier to correct for. In this particular study, the chosen bandwidth turned out to be an optimal tradeoff between distortions from off-resonances and the signal-to-noise ratio (Fig 5). We also used the tetrahedral diffusion-encoding scheme to maximize the degree of diffusion-weighting for a given TE.
Fig 5.
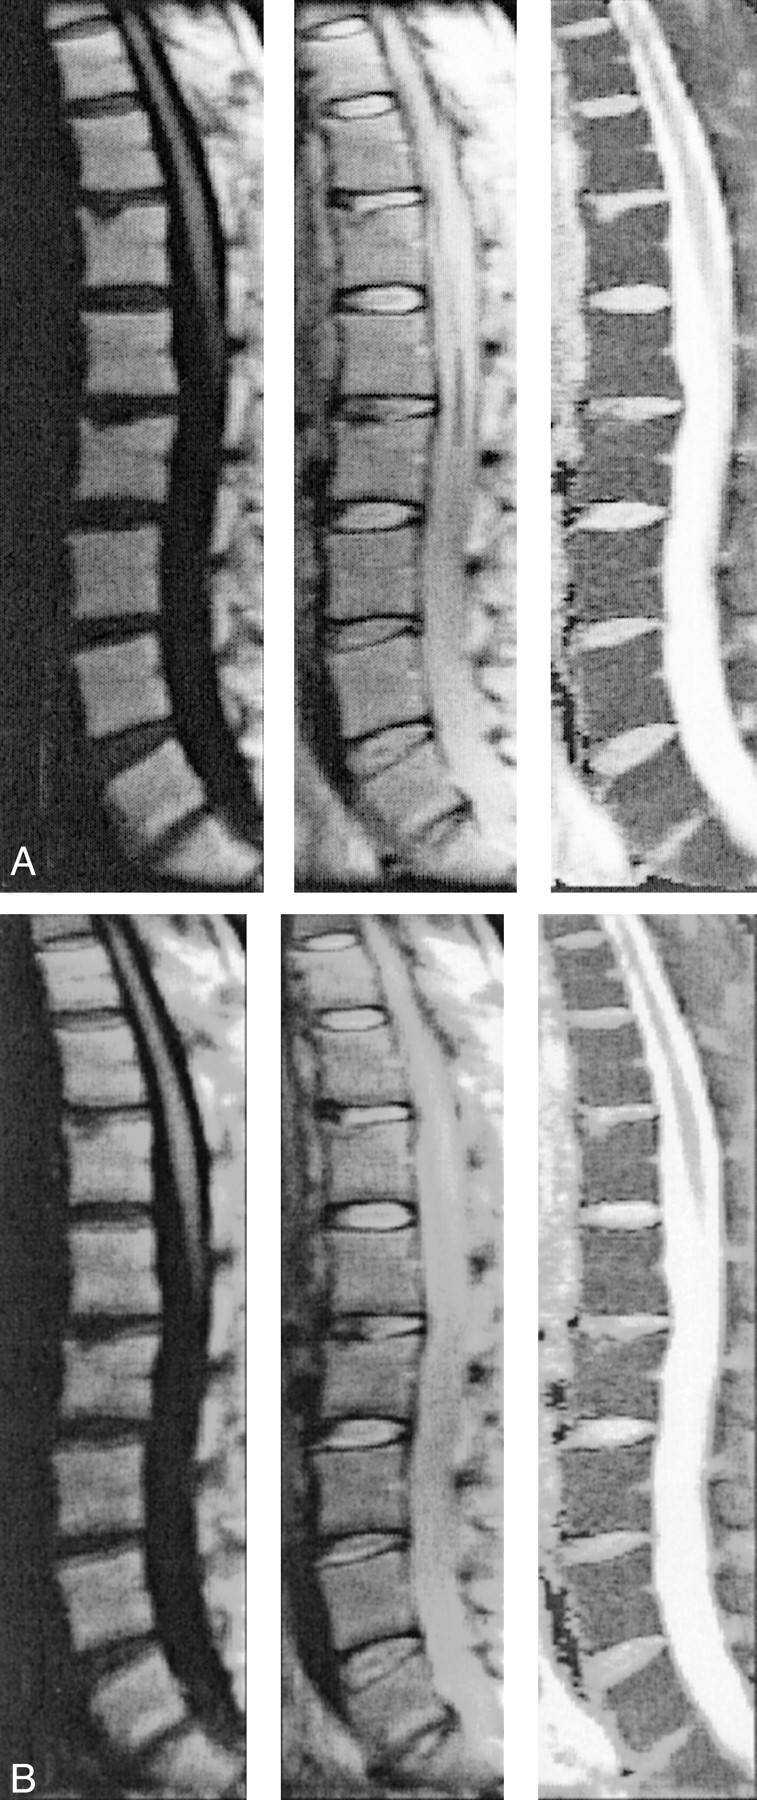
Sets of line scan diffusion images of a 48-year-old female volunteer. The images were used for comparison of off-resonance effects.
A, Receiver bandwidth of ± 15.63 kHz.
B, Bandwidth of ± 7.8 kHz. Despite the better signal-to-noise ratio, the quality of the images with lower signal-to-noise ratios clearly suffers from strong water-fat shift artifacts. In both sets, diffusion-weighted (left column) and unweighted (middle column) images are shown with their corresponding maps of mean diffusivity (right column).
Because of the high fat content in vertebral bodies, quantitative measurements revealed a rather low mean diffusivity. Conversely, a relatively high mean diffusion value was found for the intravertebral disks, especially in the nuclei pulposi and in benign vertebral compression fractures. In our group of volunteers, a small but significant variability of meandiffusion values among the different participants was noticed, whereas the fluctuation within the participants was relatively low. Whether these fluctuations among participants are dependent on age, sex, or other factors warrants further investigation. In any case, this inter-participant variability should be considered in statistical analyses, especially when measurements of different individual participants are pooled. In normal vertebral bodies, the diffusion values found in this study agreed well with those of previously published reports; some differences occurred in lesions. To which extent this discrepancy is caused by varying contributions from edema and tissues with higher cellular density or by the choice of b values is, however, not yet fully clear.
In intervertebral disks, the multiple b-value measurements did not support the hypothesis of a multi-exponential diffusion behavior. However, in vertebral bodies a bi-exponential model yielded significantly better fits (ie, smaller χ2 values) than a mono-exponential course. It is most likely that the signal course over varying b values reflects the compartments of fat and water with a slow compartmental exchange (see Fig 2). This finding is also consistent with the knowledge that lipids are rather immobile and thus show relatively low diffusivity. The pool size for the water fraction is relatively small and decays rather rapidly with increasing b values, which renders the quantification of the fast diffusion component difficult. Moreover, compared with results obtained with spectroscopy (21), the fraction of the fat found with line scan diffusion imaging is much higher. In their study, Kugel et al (21) reported a fat fraction ranging from 23.9% to 54.2%, with an increasing fractional size for older participants. This discrepancy is most likely due to differences in T2 times (T2water ≅ 45 ms, T2fat ≅ 75ms) and the TE used in our multi-b-value measurements. It should also be mentioned that a bi-exponential model has a higher degree of freedom and fits can therefore be more easily trapped in local minima of the cost function. However, the fitting process certainly benefited from incorporating the a priori knowledge of the non-Gaussian distribution of noise in MR magnitude images. These improvements are seen best in the fits for annuli fibrosi and nuclei pulposi. Without consideration of this noise distribution, the diffusion coefficient could be strongly underestimated. From Figure 2B, it is also evident that the choice of b values is very important and the observed diffusion coefficient can be strongly b value dependent.
Using conventional MR imaging, the differentiation of benign from malignant acute vertebral compression is difficult. Morphologic signs, such as complete replacement of vertebral body marrow, involvement of the posterior elements, and epidural or paraspinal masses, can improve the diagnostic accuracy but are frequently equivocal (22). In this context, results from recent studies raised the hope that diffusion-weighted imaging might be an important adjunct in the diagnostic workup of acute vertebral fractures (3–7). In most of these studies, however, no absolute quantification of the diffusion coefficient has been performed. Hence, the diagnosis was based solely on diffusion-weighted imaging examinations with which the diffusion information had been disguised by concurring MR contrast-determining effects, such as T2 shine-through effects. In this context, steady-state free precession diffusion sequences especially lack the ability to absolutely quantify diffusion (23). The latter is because the final echo formation comprises different coherence pathways and the magnitude of the coherence strongly depends on the underlying relaxation and sequence parameters (eg, TR, TE, and flip angle). In contrast to the CNS, it is much more of an issue whether diffusion-weighted imaging is performed with or without fat suppression. When lipids are suppressed, the MR signal from the remaining water measured in healthy vertebral bodies is extremely weak. Consequently, the low signal-to-noise ratio can limit the precision of diffusion measurements.
More recent quantitative diffusion measurements by Zhou et al (7) have shown that acute benign vertebral body fractures have higher diffusivity than do malignant lesions. However, they also showed that both groups overlap considerably. It was not within the scope of this article to draw conclusions regarding the capability of line scan diffusion imaging to differentiate benign from malignant fractures. To address this important question, another study with a larger cohort of patients and more statistical power is currently underway at our institution. Based on the results of the present study, however, one can already see that even with exquisite signal-to-noise ratio, the absolute diffusion values can vary, even among healthy participants.
Conclusion
Our data suggest that line scan diffusion imaging has the potential to be a powerful tool for imaging the spine. It provides excellent image quality with robustness against motion artifacts within a reasonable imaging time and provides a framework for reliable diffusion measurements. However, clinical studies are needed to further evaluate the general capabilities of diffusion-weighted imaging to differentiate bone marrow alterations and to study the diagnostic value of diffusion-weighted imaging for pathologic changes of intervertebral disks.
Acknowledgments
The authors thank Dr. Robert Mulkern, Harvard Medical School, for helpful discussions about multi-exponential diffusion behavior.
Footnotes
Supported in part by the National Institutes of Health (NIH-1R01NS35959, NIH-1R01NS39335), the Center of Advanced MR Technology at Stanford, and the Richard Lucas Foundation.
References
- 1.Moseley ME, Cohen Y, Mintorovitch J, et al. Early detection of regional cerebral ischemia in cats: comparison of diffusion- and T2-weighted MRI and spectroscopy. Magn Reson Med 1990;14:330–346 [DOI] [PubMed] [Google Scholar]
- 2.Lansberg M, Albers G, Beaulieu C, Marks M. Comparison of diffusion-weighted MRI and CT in acute stroke. Neurology 2000;54:1548–1549 [DOI] [PubMed] [Google Scholar]
- 3.Bauer A, Stabler A, Bruning R, et al. Diffusion-weighted MR imaging of bone marrow: differentiation of benign versus pathologic compression fractures. Radiology 1998;207:305–307 [DOI] [PubMed] [Google Scholar]
- 4.Leeds NE, Kumar AJ, Zhou XJ, McKinnon GC. Magnetic resonance imaging of benign spinal lesions simulating metastasis: role of diffusion-weighted imaging. Top Magn Reson Imaging 2000;11:224–234 [DOI] [PubMed] [Google Scholar]
- 5.Spuentrup E, Buecker A, Adam G, van Vaals JJ, Guenther RW. Diffusion-weighted MR imaging for differentiation of benign fracture edema and tumor infiltration of the vertebral body. AJR Am J Roentgenol 2001;176:351–358 [DOI] [PubMed] [Google Scholar]
- 6.Baur A, Huber A, Ertl-Wagner B, et al. Diagnostic value of increased diffusion weighting of a steady-state free precession sequence for differentiating acute benign osteoporotic fractures from pathologic vertebral compression fractures. AJNR Am J Neuroradiol 2001;22:241–242 [PMC free article] [PubMed] [Google Scholar]
- 7.Zhou JX, Leeds NE, McKinnon GC, Kumar AJ. Characterization of benign and metastatic vertebral compression fractures with quantitative diffusion MR imaging. AJNR Am J Neuroradiol 2002;23:165–170 [PMC free article] [PubMed] [Google Scholar]
- 8.Kerttula LI, Jauhiainen JP, Tervonen O, Suramo IJ, Koivula A, Oikarinen JT. Apparent diffusion coefficient in thoracolumbar intervertebral discs of healthy young volunteers. J Magn Reson Imaging 2000;12:255–260 [DOI] [PubMed] [Google Scholar]
- 9.Kurunlahti M, Kerttula L, Jauhiainen J, Karppinen J, Tervonen O. Correlation of diffusion in lumbar intervertebral disks with occlusion of lumbar arteries: a study in adult volunteers. Radiology 2001;221:779–786 [DOI] [PubMed] [Google Scholar]
- 10.Gudbjartsson H, Maier SE, Mulkern RV, Morocz IA, Patz S, Jolesz FA. Line scan diffusion imaging. Magn Reson Med 1996;36:509–519 [DOI] [PubMed] [Google Scholar]
- 11.Mulkern RV, Gudbjartsson H, Westin CF, et al. Multi-component apparent diffusion coefficients in human brain. NMR Biomed 1999;12:51–62 [DOI] [PubMed] [Google Scholar]
- 12.Conturo TE, McKinstry RC, Akbudak E, Robinson BH. Encoding of anisotropic diffusion with tetrahedral gradients: a general mathematical diffusion formalism and experimental results. Magn Reson Med 1996;35:399–412 [DOI] [PubMed] [Google Scholar]
- 13.Bammer R, Stollberger R, Augustin M, Ebner F, Hartung HP, Fazekas F. Improved ADC estimation from diffusion-weighted magnitude images. Presented at the 7th Annual Meeting of the ISMRM, Philadelphia,1999
- 14.Hsu EW, Setton LA. Diffusion tensor microscopy of the intervertebral disc annulus fibrosus. Magn Reson Med 1999;41:992–999 [DOI] [PubMed] [Google Scholar]
- 15.Dietrich O, Herlihy A, Dannels WR, et al. Diffusion-weighted imaging of the spine using radial k-space trajcetories. MAGMA 2001;12:23–31 [DOI] [PubMed] [Google Scholar]
- 16.Castillo M, Arbelaez A, Smith JK, Fisher LL. Diffusion-weighted MR imaging offers no advantage over routine noncontrast MR imaging in the detection of vertebral metastases. AJNR Am J Neuroradiol 2000;21:948–953 [PMC free article] [PubMed] [Google Scholar]
- 17.Bammer R, Fazekas F, Augustin M, et al. Diffusion MR imaging of the spinal cord. AJNR Am J Neuroradiol 2000;21:587–591 [PMC free article] [PubMed] [Google Scholar]
- 18.Bammer R, Augustin M, Prokesch RW, Stollberger R, Fazekas F. Diffusion-weighted imaging of the spinal cord: interleaved echo-planar imaging is superior to fast spin-echo. J Magn Reson Imag 2002;15:364–373 [DOI] [PubMed] [Google Scholar]
- 19.Robertson RL, Maier SE, Mulkern RV, Vajapayam S, Robson CD, Barnes PD. MR line-scan diffusion imaging of the spinal cord in children. AJNR Am J Neuroradiol 2000;21:1344–1348 [PMC free article] [PubMed] [Google Scholar]
- 20.Murphy BP, Zientara GP, Huppi PS, et al. Line scan diffusion tensor MRI of the cervical spinal cord in preterm infants. J Magn Reson Imag 2001;13:949–953 [DOI] [PubMed] [Google Scholar]
- 21.Kugel H, Jung C, Schulte O, Heindel W. Age- and sex-specific differences in the 1H-spectrum of vertebral bone marrow. J Magn Reson Imag 2001;13:263–268 [DOI] [PubMed] [Google Scholar]
- 22.Falcone S. Diffusion-weighted imaging in the distinction of benign from metastatic vertebral compression fractures: is this a numbers game? AJNR Am J Neuroradiol 2002;23:5–6 [PMC free article] [PubMed] [Google Scholar]
- 23.Gudbjartsson H, Patz S. Simultaneous calculation of flow and diffusion sensitivity in steady-state free precession imaging. Magn Reson Med 1995;34:567–579 [DOI] [PMC free article] [PubMed] [Google Scholar]


