Fig 2.
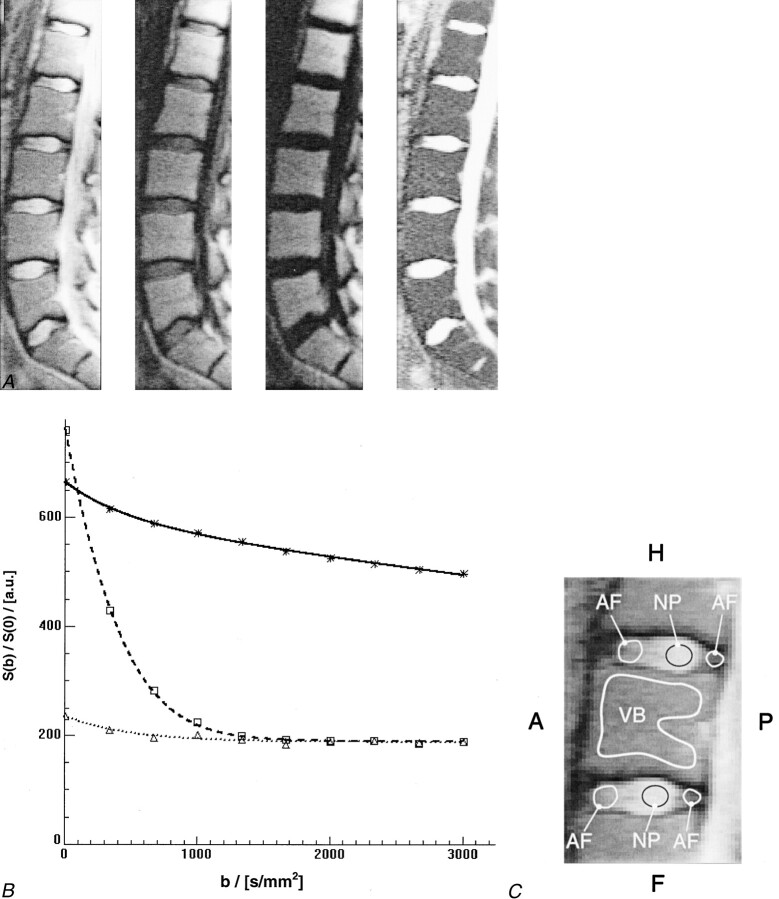
Contrast changes and corresponding signal intensities over the range of b values used for representative regions of interest for different levels of diffusion weighting.
A, Three of 10 line scan diffusion images with different levels of diffusion weighting. From left to right: line scan diffusion images with a diffusion attenuation of b = 5672, and 3005 s/mm2 and corresponding map of the mean diffusion coefficients. Although the signal intensity in the intervertebral disks decays rapidly, the signal intensity in the vertebral bodies remains almost unchanged.
B, Course of diffusion-weighted signal for region of interest measurements in an intervertebral disk and a vertebral body. The plot shows the mean values for the region of interest measurements at different b levels for vertebral body (asterisks), nucleus pulposus (squares), and annulus fibrosus (triangles) and the corresponding fitted models (continuous curves). The effect of the non-Gaussian noise distribution of magnitude MR images is best seen on the fit for nucleus pulposus and annulus fibrosus. Instead of continuous signal decay, the curve levels off asymptotically. A conventional least squares fit would be strongly biased toward lower values of diffusion if the high b-value data points had been used.
C, Magnified view of the vertebral segment shown in A shows example regions that were considered for region of interest analyses of vertebral body (VB), nucleus pulposus (NP), and annulus fibrosus (AF). A, anterior; P, posterior; H, head; F, feet.

