
Fig 5.
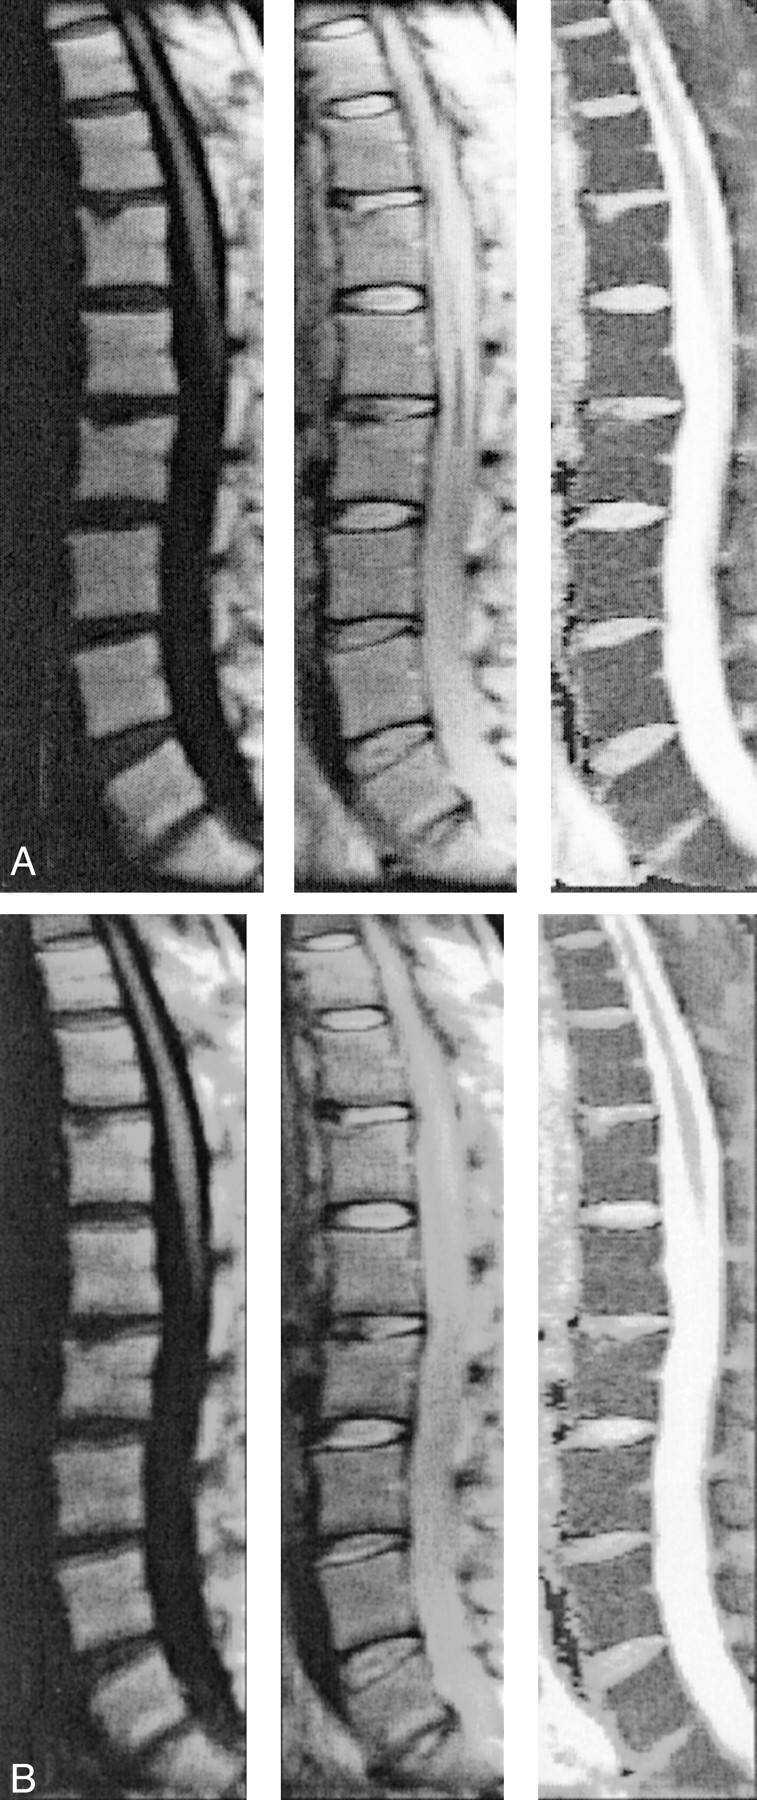
Sets of line scan diffusion images of a 48-year-old female volunteer. The images were used for comparison of off-resonance effects.
A, Receiver bandwidth of ± 15.63 kHz.
B, Bandwidth of ± 7.8 kHz. Despite the better signal-to-noise ratio, the quality of the images with lower signal-to-noise ratios clearly suffers from strong water-fat shift artifacts. In both sets, diffusion-weighted (left column) and unweighted (middle column) images are shown with their corresponding maps of mean diffusivity (right column).