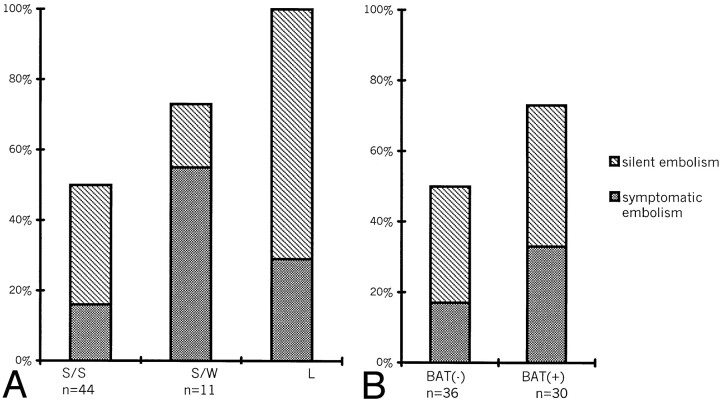
Fig 1.
Graph depicts frequency of hyperintense lesions on DW images after the procedure according to A, anatomic configuration and B, procedure performed without (BAT-) or with (BAT+) the balloon-assisted technique. Gray bars indicate symptomatic embolisms; striped bars, silent embolisms; S/S, small aneurysm with small neck; S/W, small aneurysm with wide neck; L, large aneurysm.

