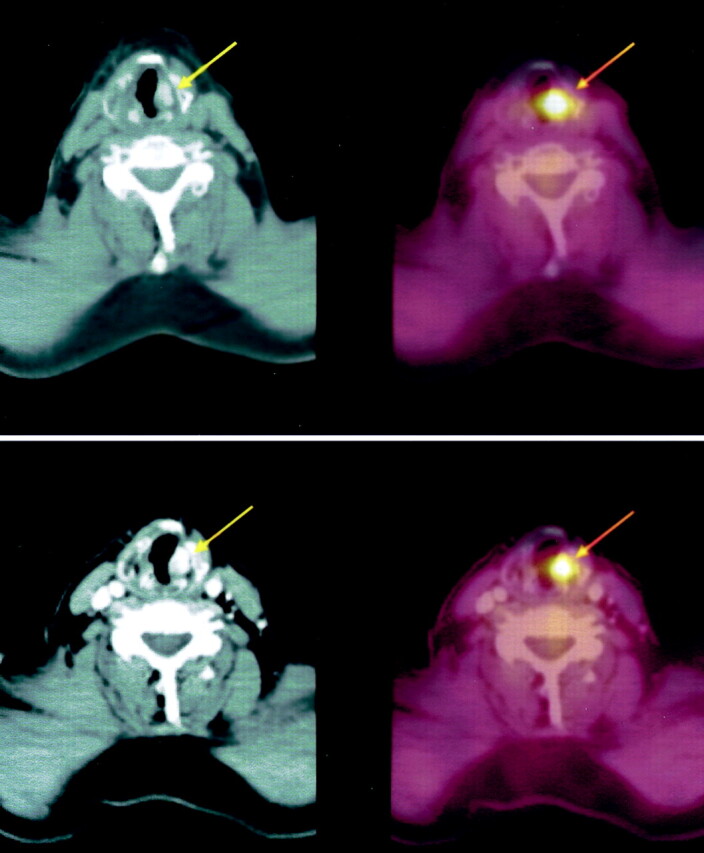
Fig 2.

Top left, Initial CT image of the neck shows an amorphous area of high attenuation in the left medialized vocal cord (arrow). Top right corresponds to the area of increased FDG uptake (arrow) shown by combined PET and CT. Bottom left shows CT findings acquired 6 months later; no change in high attenuation is noted. Bottom right shows combind CT and PET findings; no change in FDG uptake (arrow) is noted.
