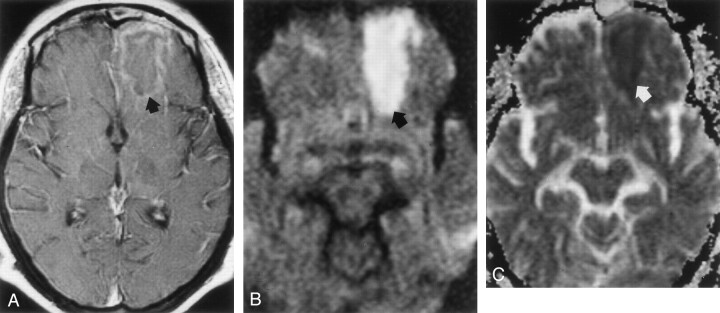
Fig 2.
MR images acquired on hospital day 9 during the late stage of cerebritis or early stage of abscess.
A, Contrast-enhanced T1-weighted image (650/17) shows thin, faint peripheral contrast enhancement around a left frontal mass (arrow).
B, DW image (b = 1,000 s/mm2) demonstrates marked hyperintensity with a rim of even higher signal intensity (arrow).
C, Restricted diffusion is indicated by hypointensity (arrow) on this ADC map. Mean ADC is 0.59 ± 0.03 (10−3mm2/s).

