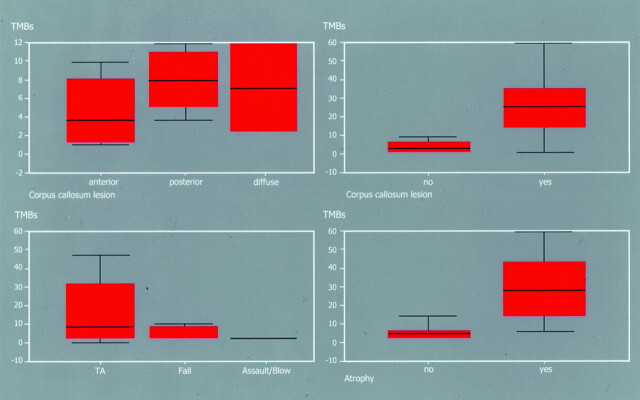
Fig 6.
Relationships between number and site of traumatic microbleeds and clinical and imaging parameters. Top left, relationship of number of traumatic microbleeds to site of a callosal lesion (P = .0001). Top right, relationship of total number of traumatic microbleeds to the existence of a callosal lesion in general (P = .0000). Bottom left, relationship of total number of traumatic microbleeds to cause of injury (TA, traffic accident; P = .0028). Bottom right, relationship of total number of traumatic microbleeds to existence of inner brain atrophy (P = .0020).

