. 2021 May 25;10:e62503. doi: 10.7554/eLife.62503

Figure 3. Tret1-1 is transcriptionally upregulated upon starvation.

(A) Tret1-1 is transcriptionally upregulated upon starvation since the Tret1-1 reporter Tret1-1>stgGFP is significantly upregulated in brains of starved compared to fed larvae as seen in western blots. Shown are images of representative western blots for anti-GFP and anti-tubulin (loading control). n=3 (A`) Quantification of Western blots. N=3. (B) Tret1-1 protein is significantly upregulated upon starvation in Tret1-1>stgGFP animals. Quantified is the GFP fluorescence normalized to DAPI in individual nuclei. N=5 , n > 34.

Figure 3.

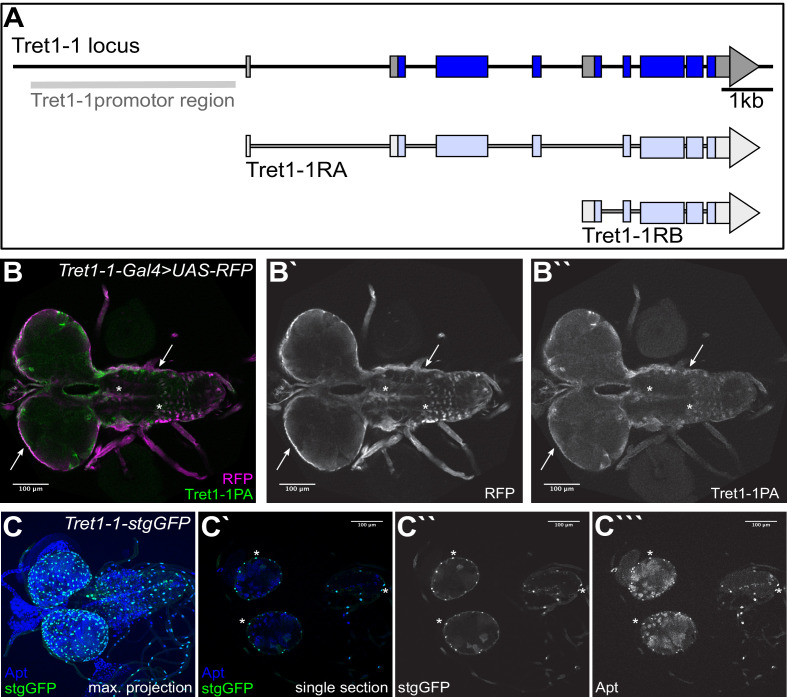
Figure 3—figure supplement 1. Tret1-1 promoter drives specific expression.

Figure 3—figure supplement 1.

(A) Schematic of the Tret1-1 locus and the transcripts encoding the two Tret1-1 isoforms. The Tret1-1 promoter region used to generate Tret1-1-Gal4 and tret1-1-stgGFP is highlighted in gray. (B–B``) Tret1-1PA staining (green, gray) overlaps with Tret1-1-driven RFP (magenta, gray) (Tret1-1-Gal4 UAS-RFP), verifying the specificity of the Tret1-1 promotor region. Arrows indicate representative overlays. (C–C```) Co-staining of Apontic (blue, gray) and stgGFP (green, gray) that shows that Tret1-1-driven stgGFP is specifically expressed in perineurial glial nuclei. Arrows indicate representative overlay expressions.