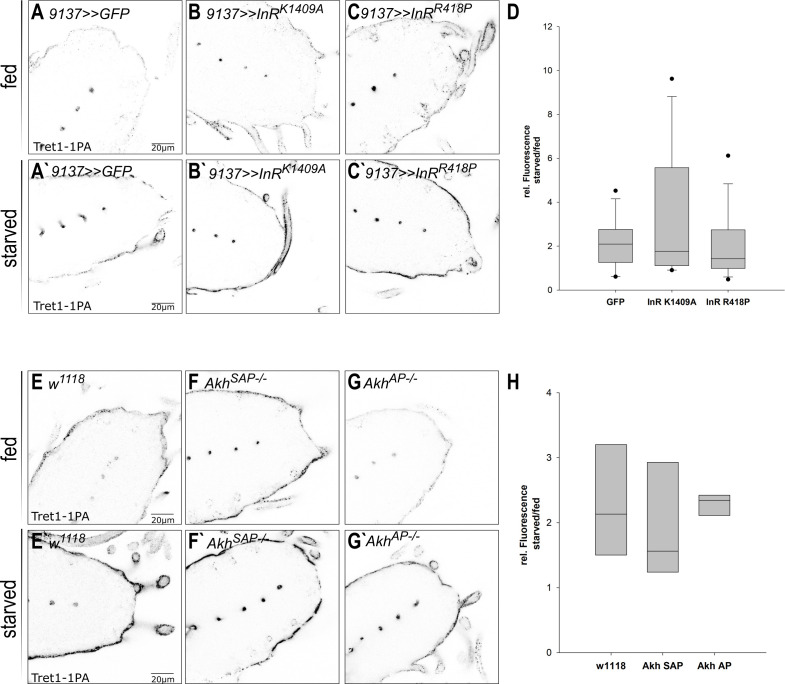
Figure 6. Tret1-1 regulation upon starvation is insulin and AKH independent.
(A–C`) Tret1-1 staining of the ventral nerve cord of starved and fed larvae expressing dominant-negative forms (InRK1409A or InRR418P) of the insulin receptor (InR) in the perineurial and subperineurial glial cells. (B, B`, C, C`) Tret1-1 levels in fed and starved animals expressing InR dominant negative are indistinguishable from wild type. (B`, C`) Tret1-1 upregulation upon starvation is seen in all cases. (D) Quantification of Tret1-1 upregulation in animals expressing InRK1409A or InRR418P. Shown is the ratio of relative Tret1-1 fluorescence intensity in the perineurial glial cells of starved versus fed animals. No significant differences between the genotypes are observed. N = 4, n = 12–16. (E–G`) Tret1-1 staining of the ventral nerve cord of starved and fed wild-type and Akh−/− mutant animals (AkhSAP or AkhAP). Tret1-1 levels in fed and starved mutant animals are indistinguishable from wild type. (F`, G`) Tret1-1 upregulation upon starvation can be seen in all mutants. (H) Quantification of Tret1-1 intensities of AkhSAP or AkhAP. Shown is the ratio of relative Tret1-1 fluorescence intensity in the perineurial glial cells of starved versus fed animals. No significant differences are observed. N = 3, n = 5–8.
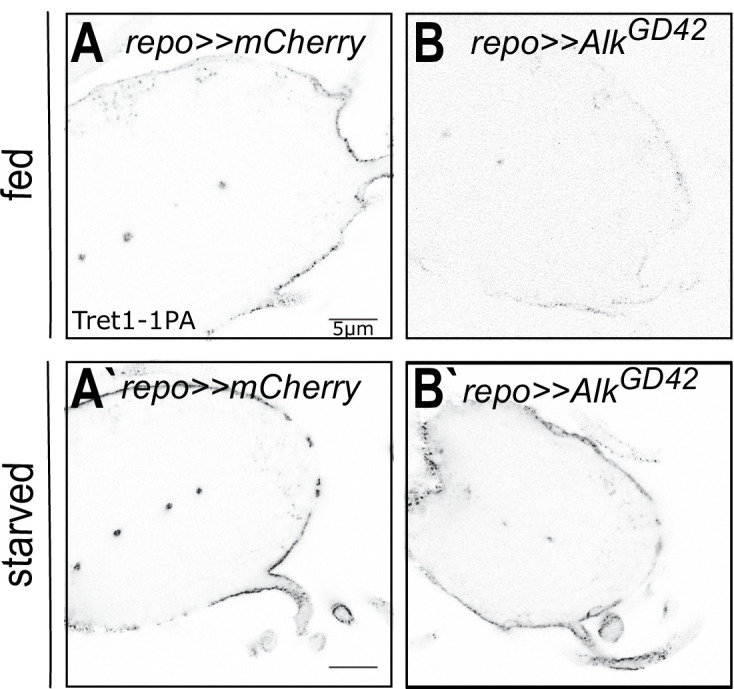
Figure 6—figure supplement 1. Tret1-1 regulation upon starvation is ALK-independent.


