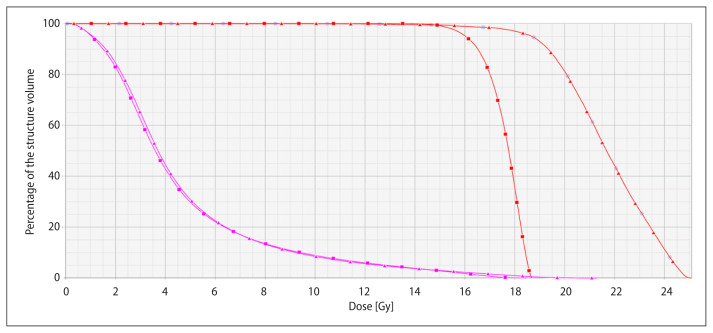
Figure 3.
DVH comparison of DA plan (red squares) for case #5 with VMAT plan (red triangle) with nearly the same values for normal tissue (magenta squares and triangles) V10 and V12. Dose to the tumor (red) can be increased from the prescribed dose in DA plan of D95 16 Gy to 18 Gy for D97 for the VMAT case

