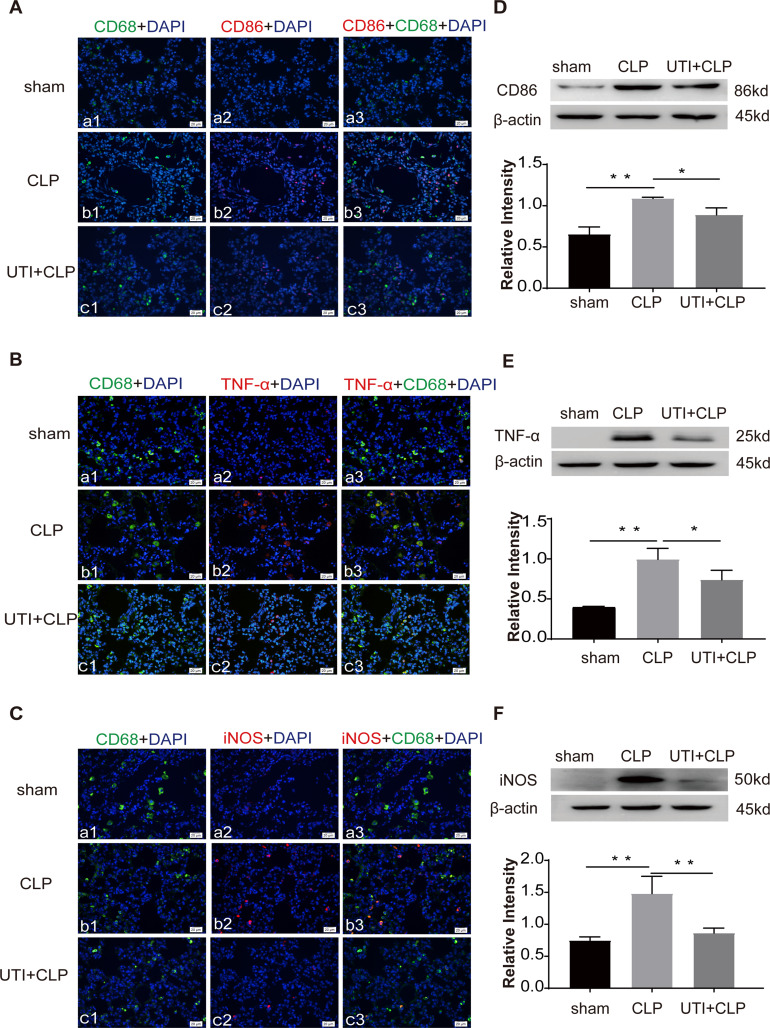
Figure 5.
UTI decreased M1 macrophages in lung tissue in CLP-induced rat lungs. CD86 (Ab1–3), TNF-α (Bb1–3), iNOS (Cb1–3) expression (red) was intensely labeled in lung tissue of the CLP group. The expression decreased in the UTI+CLP group (Ac1–3, Bc1–3, Cc1–3). It was hardly detected in the sham group ((Aa1–3, Ba1–3, Ca1–3). Western blot showing the expression of CD86 (D), TNF-α (E) and iNOS (F) sharply increased in the CLP group in comparison with the sham group; it significantly decreased in the UTI+CLP group. *p<0.05; **p<0.01.

