Figure 1.

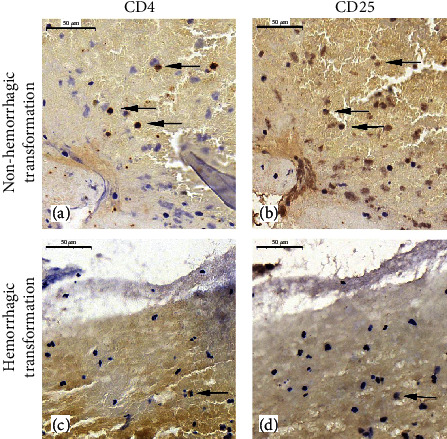
Immunohistochemical staining images of CD4+/CD25+ Treg cells in serial sections. (a) and (b) are serial images of CD4+ and CD25+ T cells among the nonhemorrhagic transformation group, respectively. (c) and (d) are serial sections of CD4+ and CD25+ T cells among the hemorrhagic transformation group, respectively. The dark arrows represent the positive-stained cells. Scale bar: 50 μm.
