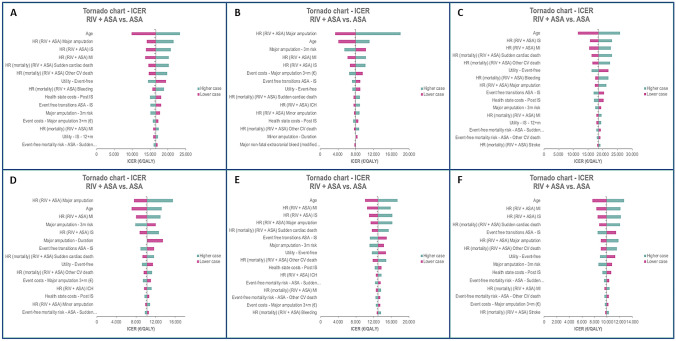
Fig. 2.
Tornado chart of the one-way deterministic analyses. Populations included are a CAD or PAD, b PAD, c CAD, d CAD and PAD, e CAD with CKD, and f CAD with HF. Pink bar indicates that the low value of the parameter has been used, and the green bar indicates that the high value of the parameter has been used. HR hazard ratio, CAD coronary artery disease, PAD peripheral artery disease, CKD chronic kidney disease, HF heart failure, RIV rivaroxaban, ASA aspirin, QALY quality-adjusted life-year, ICER incremental cost-effectiveness ratio, MI myocardial infarction, IS ischemic stroke, CV cardiovascular, ICH intracranial hemorrhage

