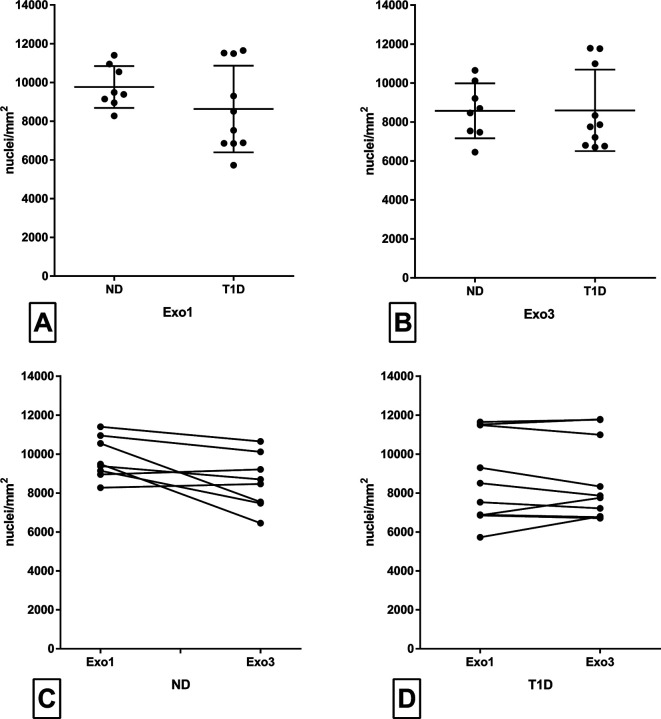
Figure 1.
Density of acinar cells (nuclei/mm2) was manually examined on formalin-fixed paraffin-embedded sections with immunohistochemical staining for synaptophysin and hematoxylin. All type 1 diabetic islets had already previously been shown to be insulin-negative by immunofluorescent staining. Regions adjacent to islets (Exo1) and regions in areas where islets were not present, a minimum of 100 µm from islets, (Exo3) were examined. Acinar density in ND was compared with T1D in Exo1 (A) and Exo3 (B). Acinar density in Exo1 was compared with Exo3 in ND (C) and T1D (D). Each dot represents an individual sample. In (A) and (B), the line illustrated the mean value, and the error bars illustrate SD. In (C) and (D), interconnected dots illustrate paired samples from the same donor. The Mann-Whitney test was used between groups in (A) and (B) and the Wilcoxon test was used in (C) and (D). ND, non-diabetic subjects; T1D, type 1 diabetic subjects.

