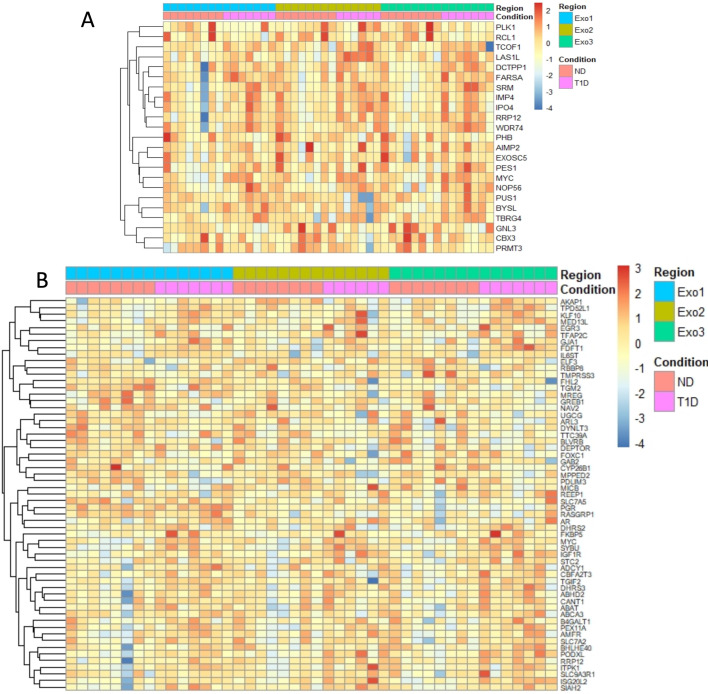
Figure 5.
(A) Heatmap of islet expression of genes in HALLMARK_MYC_TARGETS_V2 with a differential expression between ND and type 1 diabetic subjects in any exocrine region, positive or negative, relative to a threshold of log2(1.2) using a cutoff of FDR<0.70 and the glmTREAT function in edgeR. Color indicates z-score calculated from log2(TMM-CPM normalized counts), as indicated by the color key. (B) Heatmap of islet expression of genes in HALLMARK_ESTROGEN_RESPONSE_EARLY with a differential expression between ND and type 1 diabetic subjects in any exocrine region, positive or negative, relative to a threshold of log2(1.2) using a cutoff of FDR<0.70 and the glmTREAT function in edgeR. Color indicates z-score calculated from log2(TMM-CPM normalized counts), as indicated by the color key. FDR, false discovery rate; ND, non-diabetic subjects; T1D, type 1 diabetic subjects; TMM, trimmed mean of M values.

