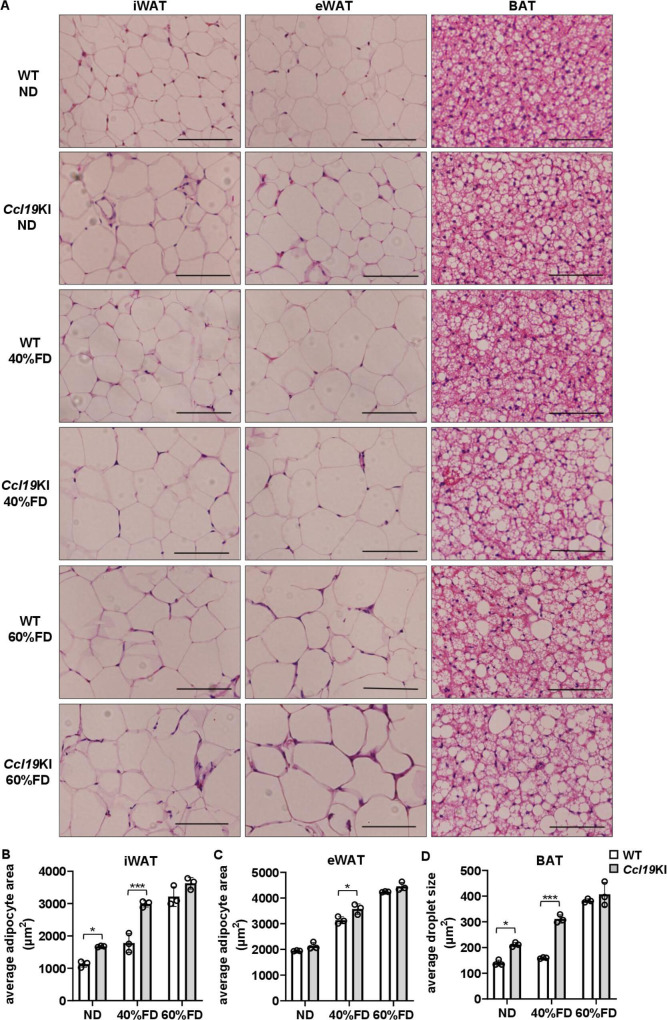
Figure 3.
Effects of CCL19 overexpression on adipocyte size. All mice were fed with a normal diet (ND) up to 7 weeks after weaning. From 7 weeks of age, mice were fed an ND, a 40%, or a 60% fat diet (40% FD, 60% FD) for 8 weeks. (A) Representative images of H&E-stained adipose tissue sections. Scale bar, 100 µm for 40× magnification. (B, C) Average adipocyte sizes of iWAT (B) and eWAT (C) were measured in four randomly chosen microscopic areas from three animals per group using a microscope. (D) Average lipid droplet sizes of bat were measured in four randomly chosen microscopic areas from three animals per group using a microscope. Note that the differences in adipocyte size and lipid droplet size between WT and Ccl19KI mice were most pronounced in groups fed a 40% FD. Data are expressed as mean (SD). *p<0.05, ***p<0.001. BAT, brown adipose tissue; CCL19, C-C motif ligand 19; eWAT, epididymal white adipose tissue; iWAT, inguinal white adipose tissue; WT, wild type.

