Figure 5.
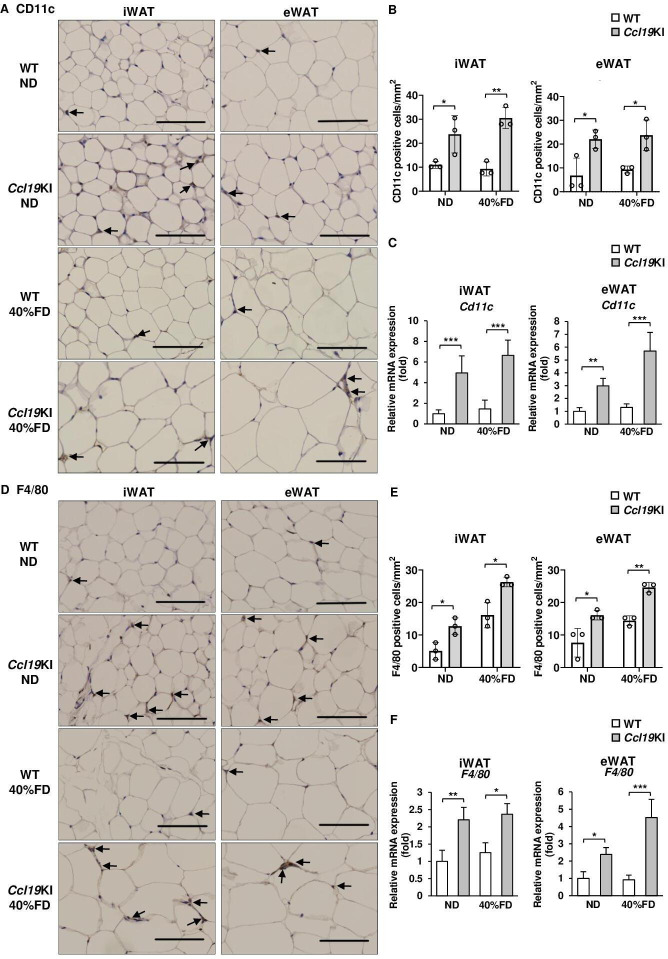
Expression of CD11c and F4/80 in the adipose tissue of WT and Ccl19KI mice fed with each diet. All mice were fed with a normal diet (ND) up to 7 weeks after weaning. From 7 weeks of age, mice were fed an ND, a 40%, or a 60% fat diet (40% FD, 60% FD) for 8 weeks. (A, D) Images of immunohistochemical staining for CD11c (A) and F4/80 (D) of iWAT and eWAT are shown. Positive area appears brown color (black arrows). Images were representative from three samples of each group. Scale bar, 100 µm for 40× magnification. (B, E) Quantification of CD11c (B) and F4/80 (E) positive cells of immunohistochemical staining (n=3 per group, with three random fields per animal). (C, F) Relative mRNA expression level of Cd11c (C) and F4/80 (F) in iWAT and eWAT of WT and Ccl19KI mice was measured by RT-PCR. Data are expressed as fold changes in the expressions of each gene relative to Gapdh (n=3–5). Data are expressed as mean (SD). *p<0.05, **p<0.01, ***p<0.001. CCL19, C-C motif ligand 19; eWAT, epididymal white adipose tissue; iWAT, inguinal white adipose tissue; KI, knock-in; WT, wild type.

