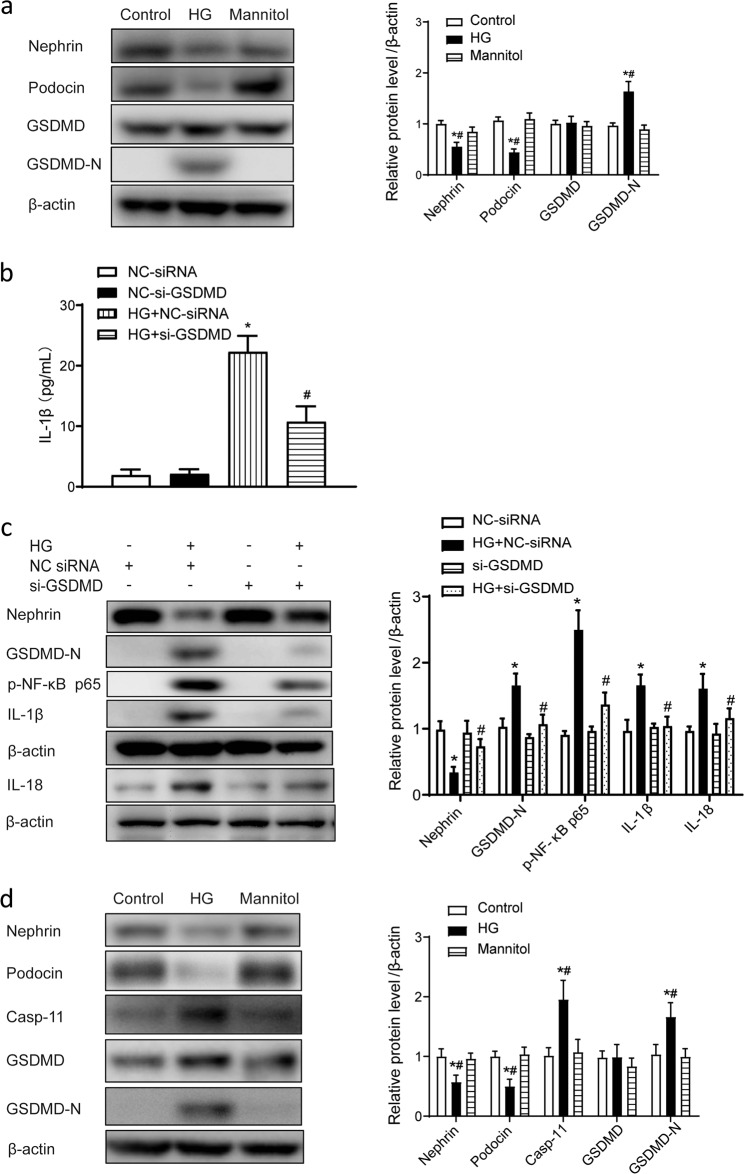
Fig. 4. GSDMD promoted the release of IL-1β in human podocytes in vitro.
a Representative Western blot gel images and summary data showing the levels of nephrin, podocin, GSDMD, and GSDMD-N in human podocytes from different groups. Data are presented as the mean ± SEM (n = 6). *P < 0.05 versus control cells. #P < 0.05 versus mannitol. b Human podocytes were transfected with GSDMD-specific siRNA (50 nmol/L) or NC-siRNA (50 nmol/L) for 48 h and then treated with high glucose (30 μmol/L) for 24 h. ELISA analysis of IL-1β levels in culture medium. *P < 0.05 versus NC-siRNA. #P < 0.05 versus HG + NC-siRNA. c Representative Western blot gel images and summary data showing the levels of p-NF-ĸB p65, IL-1β, and IL-18 after high-glucose treatment with or without caspase-4 knockdown by small interfering RNA. Data are presented as the mean ± SEM (n = 6). *P < 0.05 versus NC-siRNA. #P < 0.05 versus HG + NC-siRNA. d Representative Western blot gel images and summary data showing the levels of nephrin, podocin, caspase-11, GSDMD, and GSDMD-N in mouse podocytes from different groups. Data are presented as the mean ± SEM (n = 6). *P < 0.05 versus control cells. #P < 0.05 versus mannitol. HG high glucose, NC negative control, siRNA small interfering RNA, ELISA enzyme-linked immunosorbent assay.

