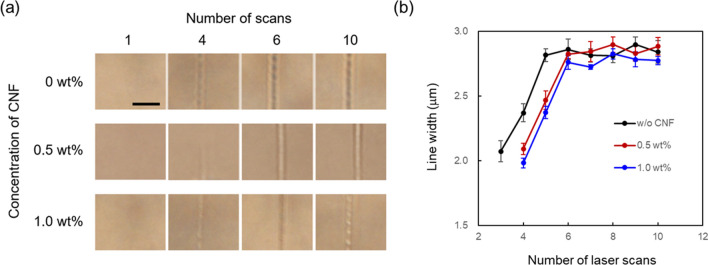
Figure 3.
(a) Optical microscope images of the fabricated microstructure with different numbers of laser scans. The scale bar indicates 10 µm. (b) Dependence of line width of the fabricated microstructure on the number of laser scans. The laser power and scanning speed were 20 mW and 125 µm/s, respectively. The line widths of the fabricated microstructures were measured at five locations, and the average value was plotted with the standard error.

