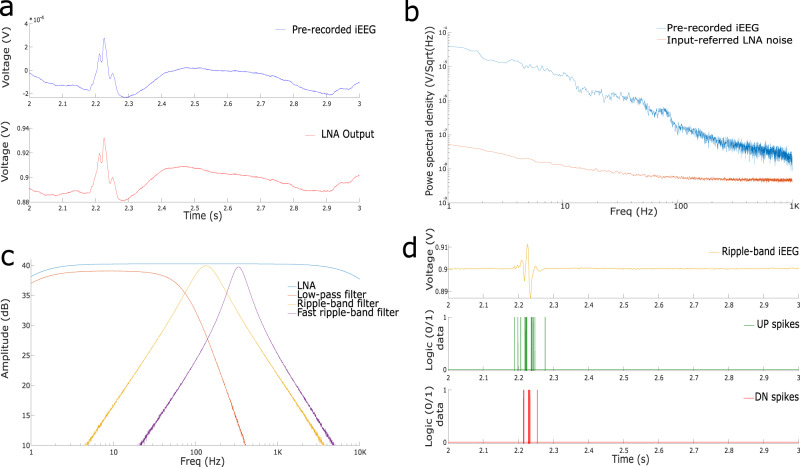
Fig. 4. Measurements from the analog headstage.
a An iEEG sample43 and the LNA amplified output. b Noise floor of the headstage LNA and iEEG power spectral density. In the HFO range (80-250 Hz) the noise level of the LNA is below the iEEG noise floor by an order of magnitude. c Frequency response of the implemented filters in the headstage. The band-pass filters are tuned to highlight HFO frequency bands. d ADM circuit simulation response to the ripple-filtered signal. The top plot shows the analog filter output, the middle plot shows the UP spikes generated by the ADM and the bottom plot shows the DN spikes.

