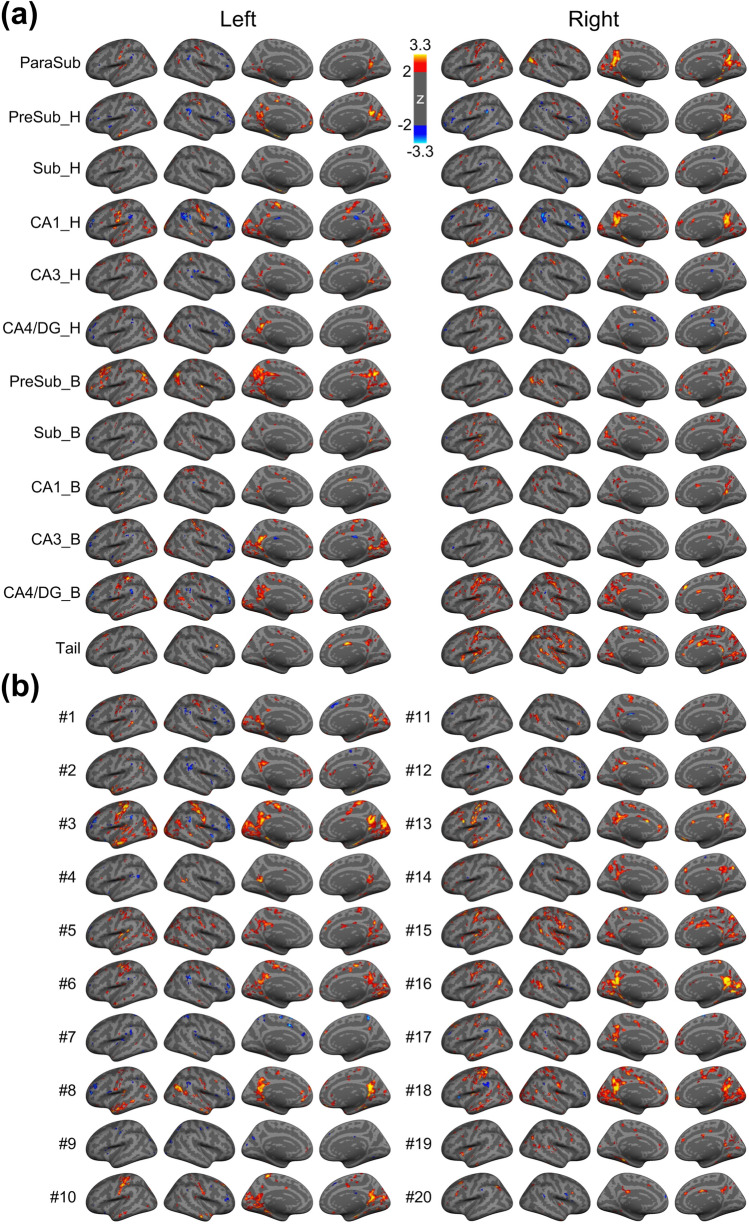
Figure 3.
Whole brain functional connectivity maps using (a) aHPSFs and (b) fHPSFs as seed regions, respectively. The statistical significances of iFC maps were assessed using a vertex-wise non-parametric permutation test with 4000 permutations. The statistical maps of iFC were corrected for multiple comparisons and cluster-wise threshold set to p < 0.05. The z scores are color-encoded as indicated by the color bar. H head; B body; Sub subiculum; CA cornu ammonis; DG dentate gyrus.

