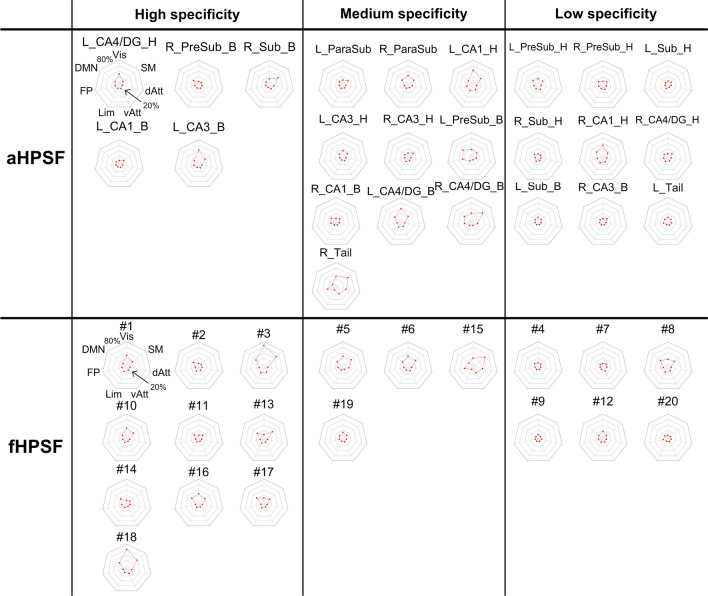
Figure 4.
The percentages of iFC coverage of each RSN associated with aHPSFs and fHPSFs. The radar plots in the right-most columns of each panel shows the percentages of each iFC map with respect to the seven intrinsic functional networks. The innermost and outermost isoparametric curves in the radar plots represent 0% and 80% respectively. The increment between adjacent isoparametric curves is 20%. The charts of aHPSFs and fHPSFs are sorted together based on the hippocampal specificity and then classified into three groups. L left; R right; other abbreviations are as described in Fig. 3 and Table 1.

