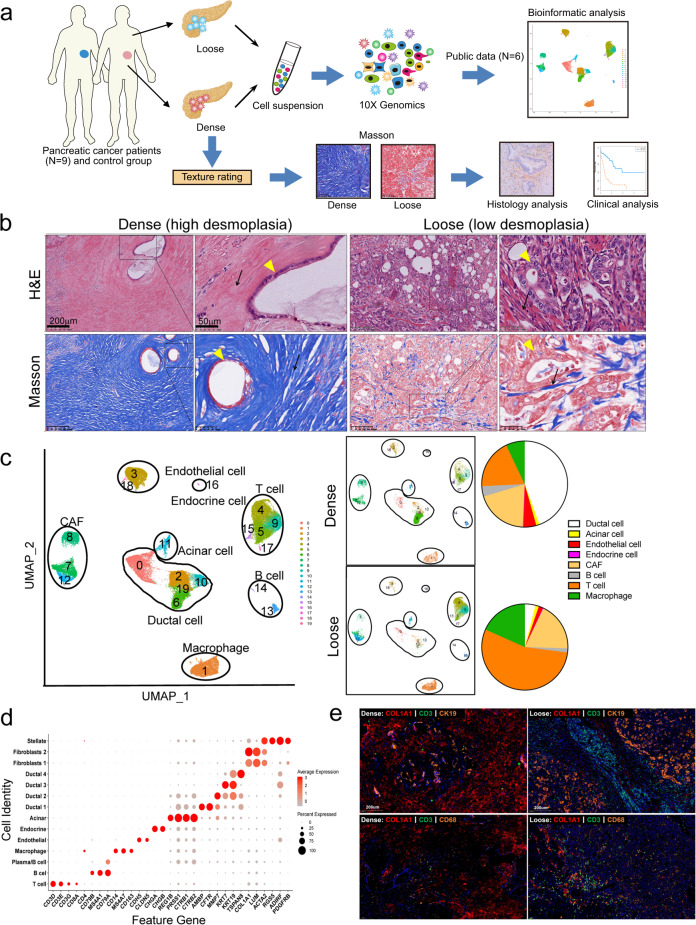
Fig. 1. Single-cell analysis reveals cellular heterogeneity between dense- and loose-type human PDACs.
a Graphical scheme describing the workflow. Nine human PDAC samples with dense or loose stroma, as well as one adjacent normal sample were dissociated into single cells followed by scRNA-seq using the 10× Genomic platform. Public scRNA-seq data from four PDAC and two normal tissues were included for comparison and joint analyses. b Representative H&E and Masson staining of four dense- and three loose-type PDAC tumors. Yellow arrow, cancer cell; Black arrow, stroma. c Unsupervised clustering of viable cells from nine human PDAC tumors, one adjacent normal sample, and six samples from public data, represented as UMAP plots. Twenty clusters and eight cell types were identified. The cell proportions from dense- and loose-type PDACs are listed. d Bubble plot showing selection of cell type-specific markers across major clusters. The size of the dot indicates the fraction of cells expressing a particular marker, and the intensity of the color represents the level of mean expression. e Immunofluorescence staining was used to confirm the changes in the proportion of different cell types in dense- and loose-type PDACs. Nine PDAC samples undergoing scRNA-Seq were stained with indicated antibodies (anti-COL1A1 for pan-CAF, anti-CD3 for T cell, anti-CK19 for epithelial cell, anti-CD68 for macrophage). Representative figures are shown. The results show that there are more infiltrating macrophages and T cells in loose-type PDAC than in dense-type.

