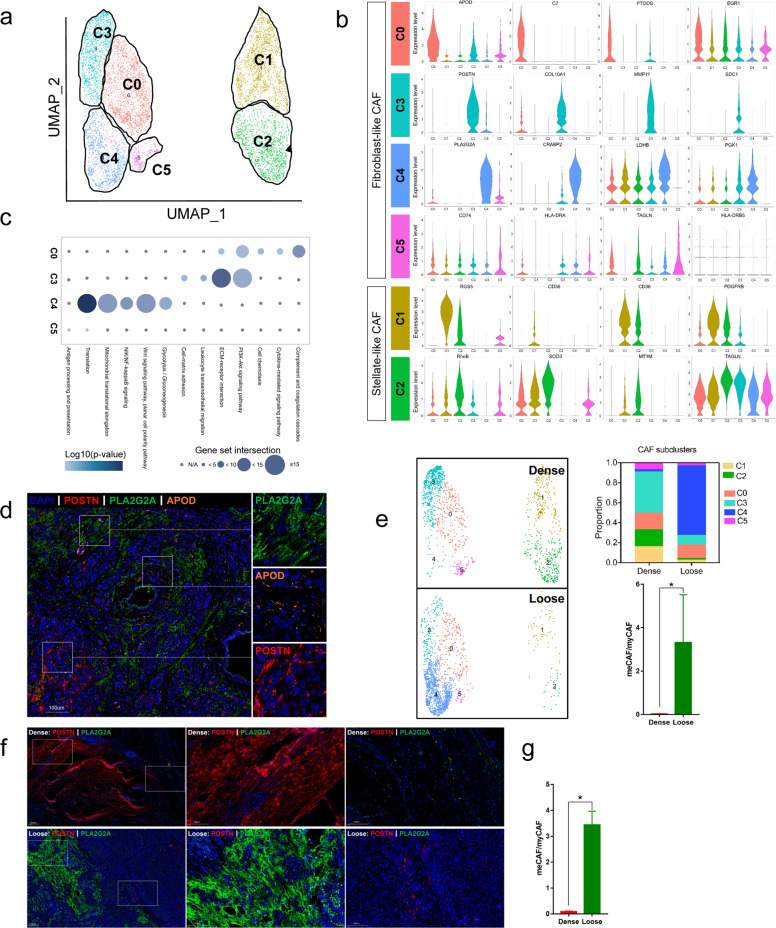
Fig. 2. Distinct CAF populations between loose- and dense-type PDACs.
a Reclustering of CAF cell types in the data set (clusters 8, 7, and 12 from Fig. 1c), represented as a UMAP plot. b Violin plot showing normalized expression of marker genes for different CAF subclusters. c Hallmark pathways enriched in the four CAF subclusters (subclusters 0, 3, 4, and 5). The size of the dot represents the intersection of marker genes of the subcluster with hallmark pathway gene sets (KEGG and GO), and the intensity of the color indicates log10 (P value). d Nine PDAC samples undergoing scRNA-seq received multiplex immunofluorescence staining to confirm the CAF subgroups in PDACs. Multiplex staining for relevant subCAF markers (APOD for C0 iCAF, orange; POSTN for C3 myCAF, red; PLA2G2A for C4 meCAF, green) showed three distinct populations (the representative image was from one loose-type PDAC). e Proportion of six different CAF subclusters in dense- and loose-type PDACs (four dense cases, three loose cases). The ratio of meCAF (C4) to myCAF (C3) for four dense cases was compared with three loose cases. The y axis represents the ratio of meCAF/myCAF for n = 7 cases (four dense cases and three loose cases). Data are presented as means ± SEM. The result showed that myCAF is the major CAF subgroup in dense-type PDAC while meCAF is the major CAF subgroup in loose-type PDAC. f Multiplex immunofluorescence staining was conducted in nine PDAC samples undergoing scRNA-seq to confirm the changes in the CAF subgroups in dense- and loose-type PDACs (POSTN for C3 myCAF, red; PLA2G2A for C4 meCAF, green). Representative images (one dense-type PDAC and one loose-type PDAC from nine PDAC samples) were shown (images of all nine patients were shown in Supplementary Fig. S6), and the results showed that the expression of myCAF marker in dense-type PDAC was high while meCAF marker was highly expressed in loose-type PDAC. g The ratio of meCAF (PLA2G2A+ CAFs) to myCAF (POSTN+ CAFs) for seven cases (four dense-type and three loose-type cases). The y axis represents the ratio of meCAF/myCAF in visual fields (40×). Data are presented as means ± SEM. All statistical analyses were performed with the two-sided Mann–Whitney U test. *P < 0.05.

