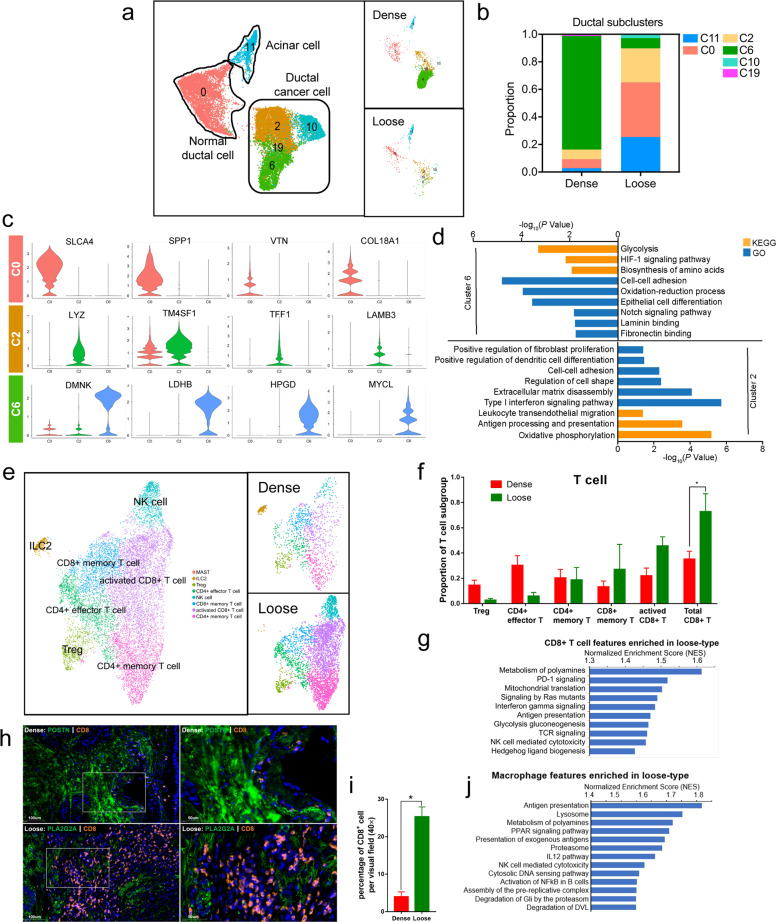
Fig. 3. Distinct features of ductal cells and immune cells in dense- and loose-type PDACs.
a UMAP plot of acinar cells and ductal cells in dense- and loose-type PDACs. b Proportion of cells from acinar and ductal cells in dense- and loose-type PDACs. c Violin plots of selected marker genes from clusters 0, 2, and 6, showing normalized expression in the different clusters. d KEGG and GO analysis comparing cluster 6 against cluster 2. e Reclustering of T-cell types in the data set (clusters 4, 5, and 19 from Fig. 1c), represented as a UMAP plot. f Proportion of T-cell subpopulations in dense- and loose-type PDACs (four dense cases, three loose cases). The proportion of the CD8+ T-cell group in all T cells is significantly increased in loose-type PDAC. The y axis represents the proportion of each T-cell subgroup in all T cells, and the x axis represents different T-cell subgroups. Red column and green column represent dense-type PDAC and loose-type PDAC, respectively. Data are presented as means ± SEM. All statistical analyses were performed with the two-sided Mann–Whitney U test. *P < 0.05. g GSEA showing enriched pathways in CD8+ T cells comparing loose-type against dense-type PDAC. h Multiplex immunofluorescence staining was conducted in nine PDAC samples undergoing scRNA-seq to confirm the correlation between CAF subpopulations and infiltrating CD8+ T cells (n = 9, POSTN for myCAF, PLA2G2A for meCAF, CD8 for CD8+ T cell). Representative immunofluorescence results showed much more infiltrating CD8+ T cells in loose-type PDAC than in dense-type PDAC. i Quantification of CD8+ T cells for n = 7 cases (four dense cases and three loose cases), including representative case. The y axis represents percentage of CD8+ T cell per visual field (40×), and the x axis indicates dense-type PDAC and loose-type PDAC, respectively. Data are presented as means ± SEM. All statistical analyses were performed with the two-sided Mann–Whitney U test. *P < 0.05. j GSEA showing enriched pathways in macrophages comparing loose-type against dense-type PDAC.

