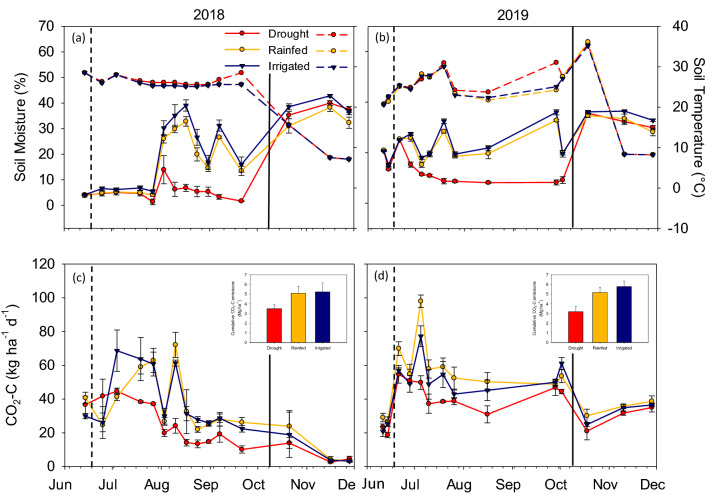
Figure 3.
Soil temperature and soil moisture (0–5 cm) as influenced by moisture treatments in 2018 (a) and 2019 (b). Dashed line in the legend represents the soil temperature and solid line represents the soil moisture. Daily CO2 fluxes during the growing season in 2018 (c) and 2019 (d). Legend for daily CO2 fluxes is same as soil moisture. Vertical dashed line represents shelter establishment date and solid line represents shelter removal date. Inset: cumulative CO2 emissions during the growing season. Error bars represent standard error (n = 3).

