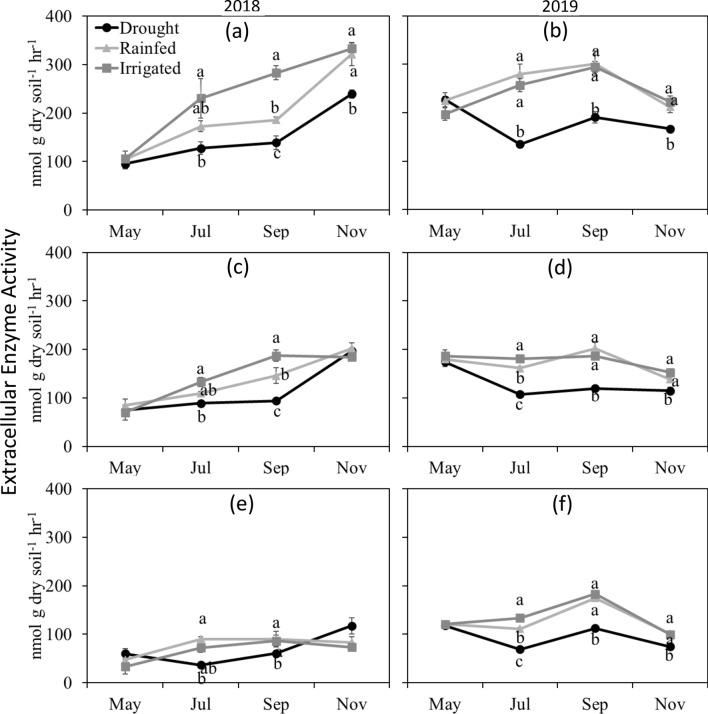
Figure 6.
Total extracellular hydrolytic enzyme activity under drought, rainfed, and irrigated treatments at 0–5 (a,b), 5–15 (c,d) and 15–30 (e,f) cm depths during 2018 and 2019. Different letters represent statistical significance at p ≤ 0.05 at each time point. No letters mean no statistical significance. Error bars represent standard error (n = 3). Sampling in May represents baseline and in November represents post shelter removal.

