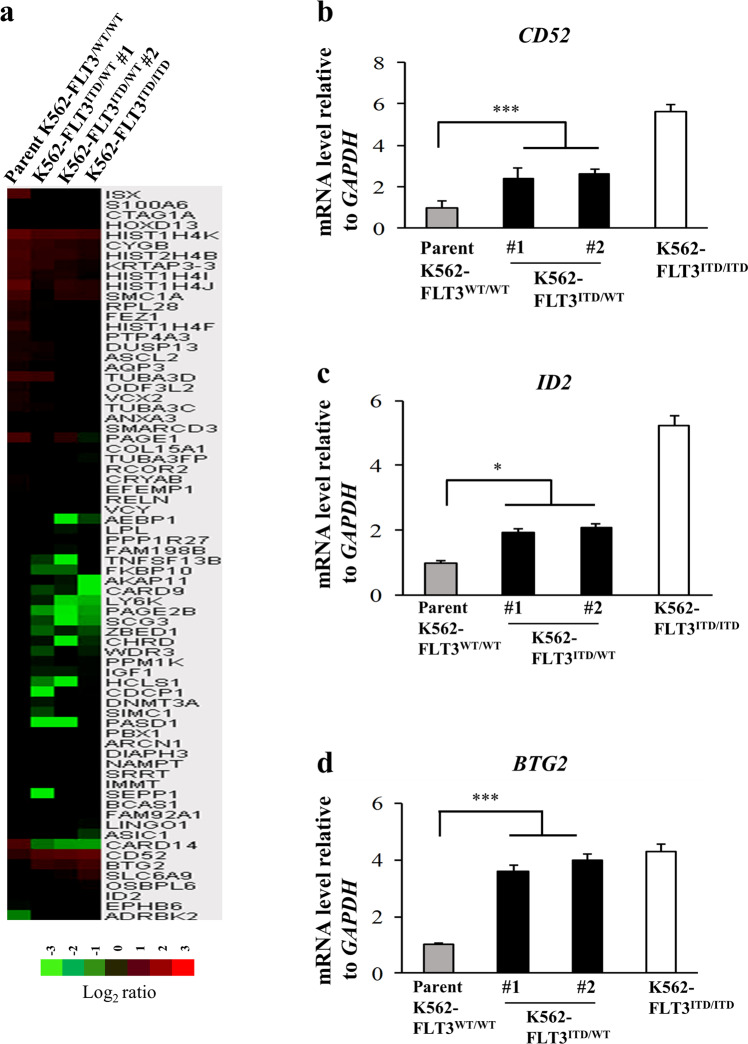
Fig. 2. Comparative gene expression profiling and quantitative real-time PCR (qRT-PCR) analysis.
a A heat map of upregulated or downregulated genes in the parent K562–FLT3WT/WT, K562–FLT3ITD/WT, and K562–FLT3ITD/ITD cell clones, as determined by microarray analysis. cDNA microarray analysis was performed using the Agilent Whole Human Genome cDNA Microarray Kit (4 × 44 K; Design ID, 026652). A fold change of >2.0 was considered an upregulated gene, and a fold change of <0.5 was considered a downregulated gene. The heat map was constructed with TreeView (Cluster 3.0) software using normalized values for each sample. The corresponding upregulated or downregulated gene names in the heat map are shown on the right side. b–d Three genes, CD52, BTG2, and ID2, that were upregulated in K562–FLT3ITD/WT, and K562–FLT3ITD/ITD cell clones, as determined by the cDNA microarray analysis, were subjected to qRT-PCR analysis in the indicated K562 cell clones using the SYBR Green method. Relative gene expression levels are shown after normalization to GAPDH mRNA levels. Data are expressed as mean ± SE (n = 3). Asterisks indicate significant differences between parent K562–FLT3WT/WT cells and K562–FLT3ITD/WT using two-tailed non-paired one-way analysis of variance (ANOVA), followed by post hoc Student’s t-test analysis. *p < 0.05, ***p < 0.001.

