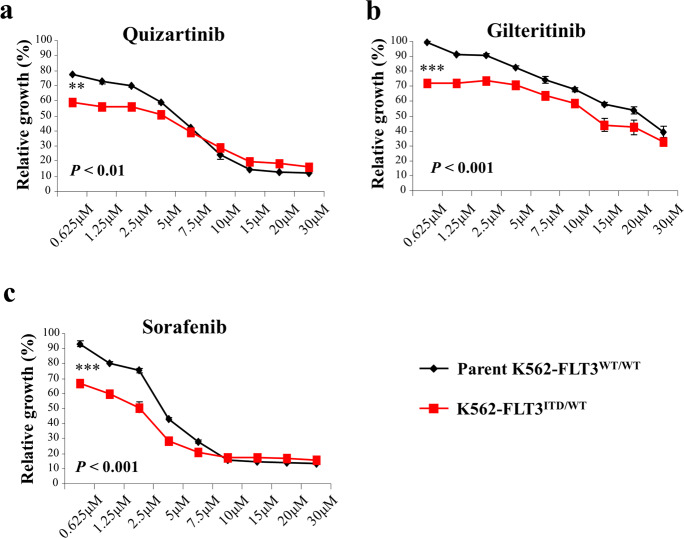
Fig. 5. Effect of FLT3 inhibitors on cell proliferation of parent K562–FLT3WT/WT and K562–FLT3ITD/WT cells.
a–c Effect of quizartinib (a), gilteritinib (b), and sorafenib (c) on cell proliferation in parent K562–FLT3WT/WT and K562–FLT3ITD/WT cells. Cells were treated with the indicated concentration of inhibitors for 48 h. Cell growth was measured by the MTT assay. Black and red lines indicate parent K562–FLT3WT/WT cells and K562–FLT3-ITD/WT cells, respectively. Data are expressed as mean ± SE (n = 3). Asterisks indicate statistically significant differences between parent K562–FLT3WT/WT cells and K562–FLT3ITD/WT using two-tailed non-paired one-way analysis of variance (ANOVA), followed by post hoc Student’s t-test analysis. **p < 0.01, ***p < 0.001.

