
Figure 4. Measured D-dimer change from baseline.
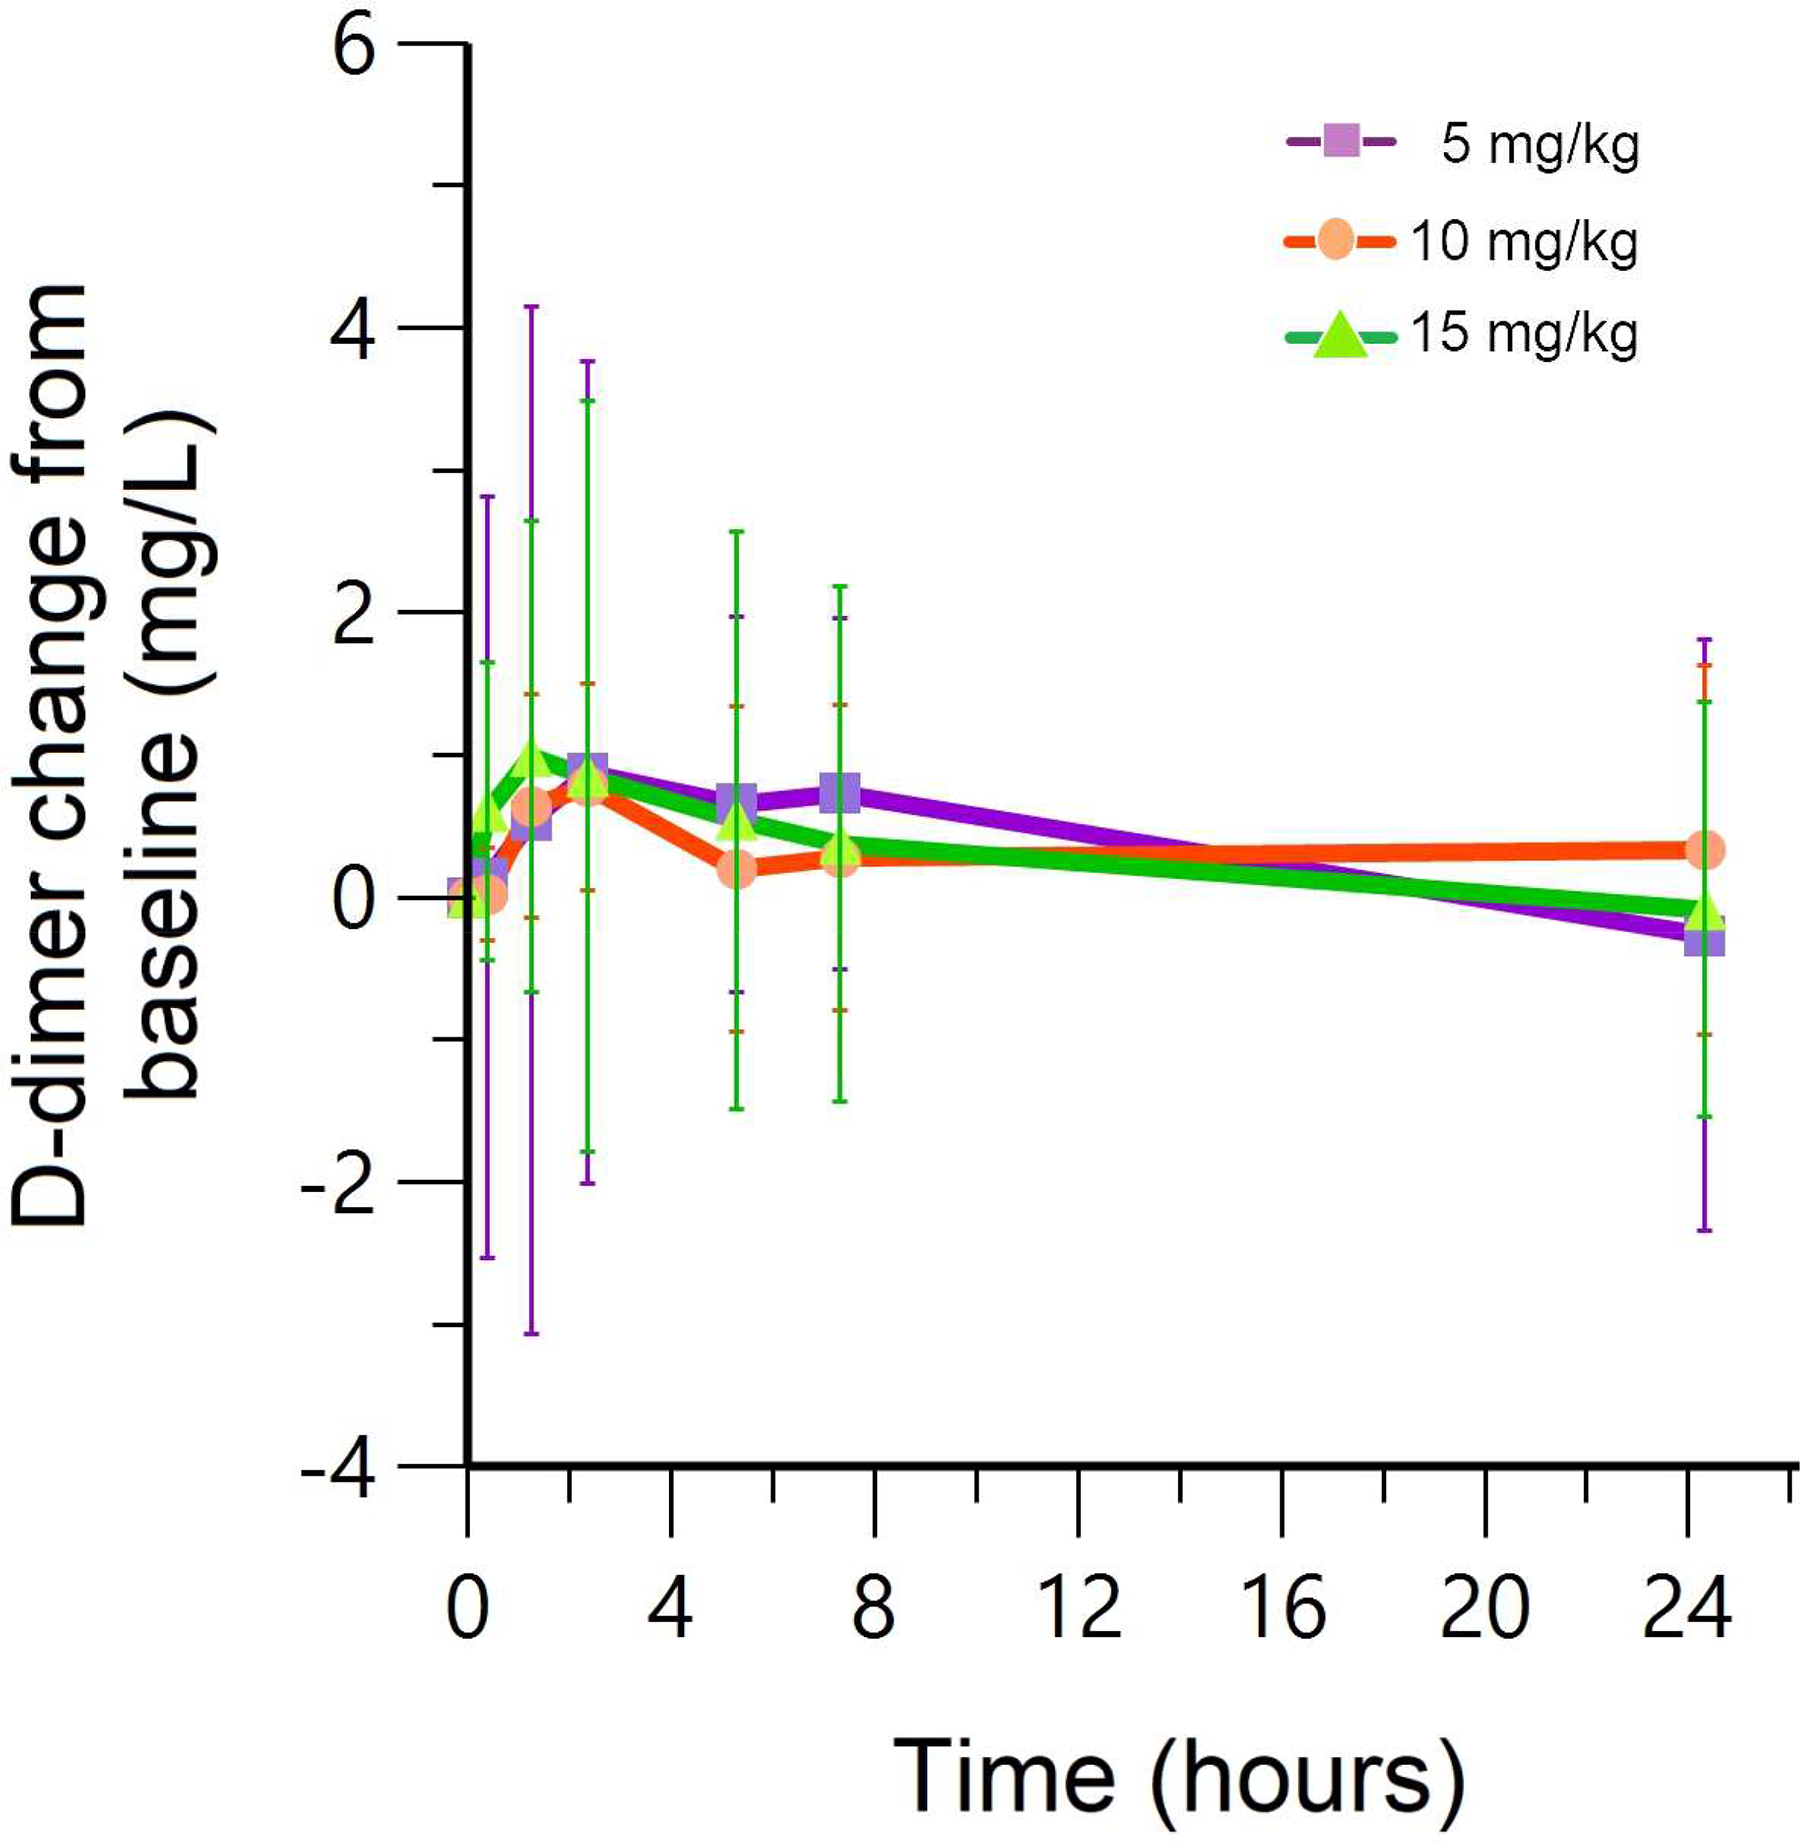
Observed mean (symbols) and population mean (lines) D-dimer concentration-time profiles after 5 mg/kg, 10 mg/kg and 15 mg/kg IV doses derived from 30 patients. Error bars (1SD) are also shown. There is no significant difference in D-dimer change from baseline with increasing TXA concentrations.