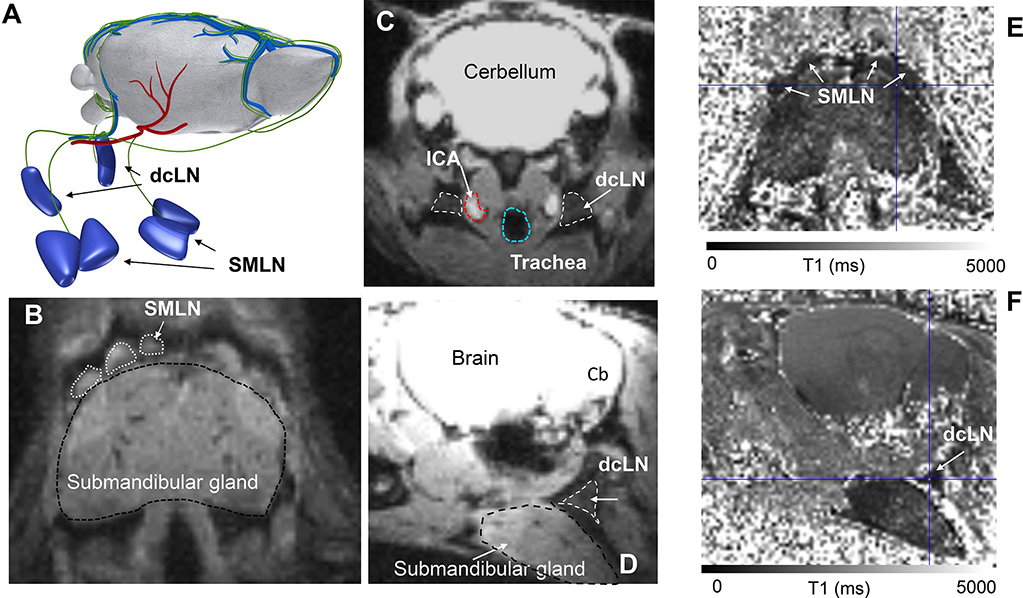
Fig. 3: T1 mapping for quantifying glymphatic and cervical lymph node transport.
A: Illustration of the superficial submandibular lymph nodes (SMLN) and deep cervical lymph nodes (dcLN) in relation to the whole rodent brain. The green vasculature represents meningeal and extracranial lymphatic vessels draining to the nodes. We note that the illustration of the afferent draining lymphatics to the nodes are not based on accurate anatomical landmarks. B: Proton density weighted (PDW) MRI from a mouse at the level of the submandibular gland showing the position of the SMLN. C: PDW MRI from mouse illustrating the position of the dcLN in relation to key anatomical landmarks including the internal carotid artery (ICA) and trachea in an axial cut. D: Sagittal cut of the same PDW MRI shown in C, illustrating that the dcLN is positioned deep to the submandibular gland. E: Corresponding T1 map from a mouse shown in B after CSF administration of Gd-DOTA. The darkness of the SMLNs indicates that Gd-DOTA has drained from the CSF/brain to the nodes thereby shortening the T1. F: The same T1 map as shown in E now sliced at the level of the dcLN which appear as a dark triangle due to uptake of Gd-DOTA. MRI data are from Xue et al., (Xue, et al., 2020).

