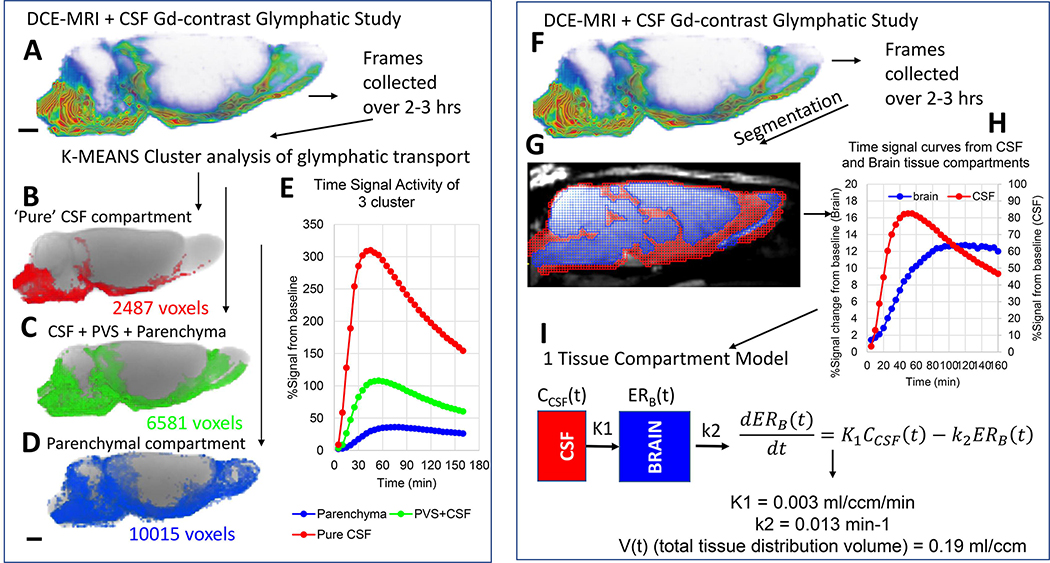
Fig. 4: Glymphatic transport analysis by k-means cluster analysis and kinetic modeling.
A: DCE-MRI glymphatic study with CSF Gd-DOTA from a normal 3M old Sprague Dawley rat. The time-series of DCE-MRI images is used as data input for the k-means cluster analysis. B-D: Three tissue ‘cluster’ compartments derived from the cluster analysis are shown as binary volume rendered color-coded masks overlaid on the corresponding anatomical brain. The red cluster (B) represents the smallest volume and is located in the CSF compartment proper. The large blue cluster represents ‘parenchymal’ glymphatic transport (D). The green cluster (C) represents mixed cluster of subarachnoid CSF, peri-vascular CSF of large arteries as well as adjacent tissue. E: The corresponding time signal curves (TSC) from each of the three clusters are shown. The red CSF cluster TSC is characterized by high peak magnitude (~300% signal increase) and rapid decay. The blue parenchymal TSC is characterized by lowest peak signal magnitude and slowest decay when compared to the other two clusters which contain CSF. F: DCE-MRI glymphatic study of normal rat. G: The red and blue masks overlaid on the MRI represent the CSF and tissue compartment derived using voxel-based morphometry analysis. H: The CSF and tissue masks are used to extract TSC from the two compartments. I: Mathematical expression of 1-tissue compartment model and the derived quantitative output. K1 = influx rate constant and k2 is the efflux rate constant. For more detail see (Mortensen, et al., 2019).

