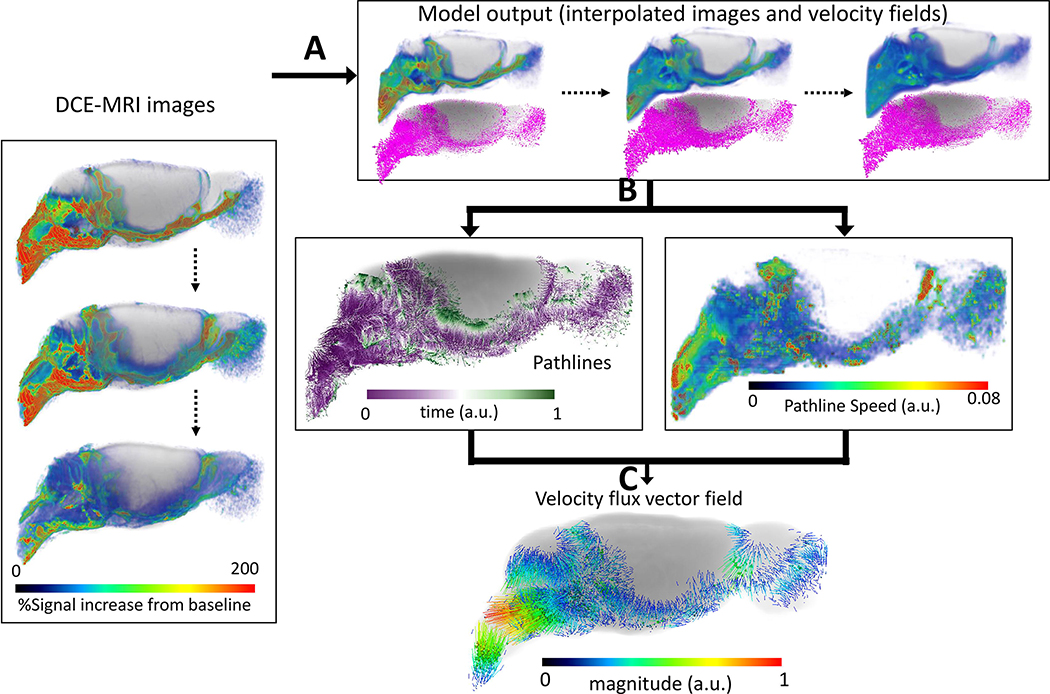
Fig. 5: Regularized optimal mass transport (rOMT) analysis of glymphatic solute transport.
Computational processing pipeline of rOMT analysis: A: DCE-MRI images over a pre-defined time period (45–210 min) after CSF administration of Gd-DTPA are fed into the transport (rOMT) model which, returns interpolated images and dynamic velocity fields. B: Lagrangian dynamic formulation is employed to process the output to obtain glymphatic solute pathlines and pathline speed. The binary pathlines show the trajectories of solute transport and the purple to green color of each pathline represents start points to end points, respectively. The total volume of the pathline network measures the volume of dynamic glymphatic flow. The pathline speed reflects the relative speed within the pathlines which, is used to evaluate transport difference across the brain compartments. C: The velocity flux vector field of the pathlines can also be derived and demonstrates the direction and magnitude of glymphatic solute movement. (MRI data are from Benveniste et al., (Benveniste, et al., 2017)).

