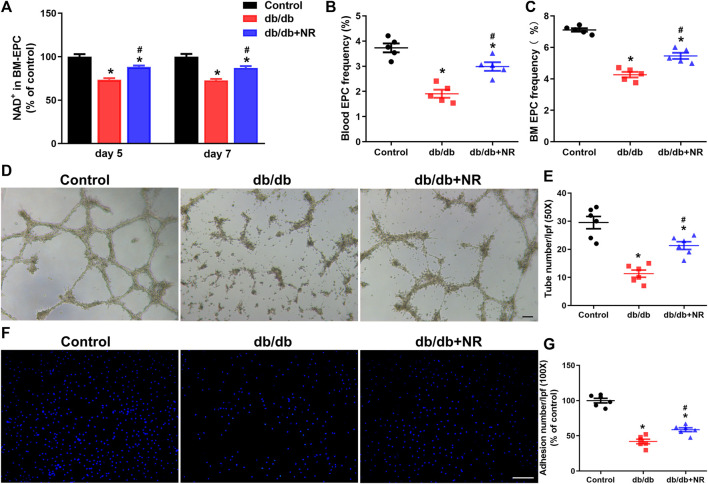
FIGURE 3.
Effects of NR supplement on EPC number and BM-EPC function in db/db mice. (A) NAD concentrations in cultured BM-EPCs (day 5 and day 7 in vitro) isolated from mice. Blood EPC (B) and BM EPC (C) frequency in normal control and db/db mice. Tube formation (D,E) and cell adhesion (F,G) of BM EPC isolated from normal control and db/db mice. D: 50×; scale bar, 100μm; F: 100×; scale bar, 100 μm. Values are mean ± SEM (A, B, C: n = 5; D, E, F, G: n = 6). *P < 0.05 vs. Control; # P < 0.05 vs. db/db. BM, bone marrow; BM-EPC, bone marrow–derived endothelial precursor cell.

