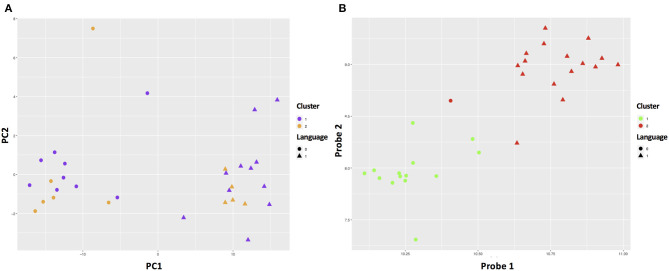
Figure 4.
ASD subgroups identified using RF and PAM clustering algorithms. Dim1 and Dim2 correspond to principal components 1 and 2, respectively. (A,B) The results based on the top 10 principal components (PCs) and the 191 probes, respectively. We used the first two predictors to make the plots to demonstrate how different approaches classified the sample.

